Anti-vaccers are fundamentally wrong about placebo-controlled trials

Anti-vaxxers love to demand placebo-controlled trials and insist that nothing else will suffice for demonstrating vaccine safety. This approach to medical research is flawed for a number of reasons. First, as I’ve explained previously, new vaccines are, in fact, tested against placebos. Truly novel vaccines (e.g., COVID vaccines) get tested against an inert, saline placebo (e.g., Polack et al. 2020), while updates to existing vaccines typically get tested against the previous versions of the vaccine, because those versions already have known safety and effectiveness profiles.

There is, however, a more fundamental issue with this insistence on placebo-controlled trials. Namely, they are not actually the best tool for examining vaccine safety, and cohort and case-control trials are often more useful. I’ve talked about this a number of times before (here, here, and here), but in this post, I want to try a more visual approach and actually show some data to illustrate the point.

As a brief thesis statement, correlation doesn’t automatically equal causation, but a lack of correlation does suggest a lack of causation (see note at end). Therefore, you do not need a placebo-controlled trial to make a statement like “vaccines do not cause autism” (within the statistical limits described below), and other study designs like cohort studies and case-control studies are actually better.

Note: we usually use “correlated” for continuous variables that change together (regressions) and “associated” for discrete variables, but for simplicity, I will just use “correlated” throughout.

Types of studies

There are three types of studies that are most relevant to this post (more details are here).

The first is the classic randomized controlled trial (aka RCT). In medical research, these are usually also placebo-controlled. This design takes a group of subjects, randomizes them into a treatment group (i.e., the group that receives a medicine) and a control group that receives a placebo instead of medicine. Some outcome of interest (e.g., a side effect) is then recorded in each group, and the rates of that outcome are compared.

Next, we have cohort studies. These use the same basic design as randomized placebo-controlled studies, but they are not manipulative. So rather than randomizing people into groups, it simply looks at groups who did and did not take a treatment (often via medical records) then compares the rates of the outcome of interest.

Finally, case-control studies work backwards. They identify a group of people with the outcome of interest (the “cases”) then match them with a group of people who are similar demographically but don’t have the outcome of interest (the “controls”). Then, the rates of a potential cause are compared between the groups.

Why randomize?

At the outset, we need to briefly discuss why randomized controlled trials (which, in medicine, are typically placebo-controlled) are generally so useful, as well as the nature of causation (note that the explanation below is simplified for the sake of brevity).

When we say that two things are correlated, we mean that they change together. So, there is a relationship between the two variables. The problem is that simply being related doesn’t mean that one thing is causing the other. For example, they could both be being caused by a third factor.

To use a famous example, ice cream sales and drowning are positively correlated (they both increase and decrease together). That does not, however, mean that ice cream causes drowning. Rather, a third factor (high temperatures) causes people to buy more ice cream and spend more time swimming (which results in more drowning accidents).

When we are trying to test for causation scientifically, we need to be extremely confident that there is no third factor driving the relationship. This is where randomization comes in. By randomly dividing people into two groups, we spread out all additional factors between the two groups so that no third factor can drive the results. This is the reason why randomized trials can confidently assert causation, while cohort and case-control trials cannot. For those designs, we can do our best to account for confounding factors (third factors) in the models, but it is always possible that we missed something. We just don’t have the confidence that we do with randomization.

So, if you want to say that X causes Y, you need a randomized trial. However, you do not need a randomized trial to say that X does not cause Y.

If you think about this for a second, the reason should be obvious. If X causes Y, then they will inherently, by definition, be correlated. Therefore, if they are not correlated, then X cannot be causing Y. Any time that X causes Y, there will be a correlation. So, no correlation = no causation (see note at end).

This means that a statement like, “vaccines don’t cause autism” does not need randomized, placebo-controlled trials to back it up, and, as we’ll see below, other designs are actually better.

Finally, it is worth mentioning that the purpose of the placebo is to get a good measure of the background experimental error rates (e.g., regression to the mean). This is really important for something like measuring whether a drug improves symptoms. It is substantially less important for outcomes like whether or not patients get an emerging infectious disease or rare side effects (more on placebos here).

The power of cohort and case-control trials

The big limitation of placebo-controlled trials (beyond ethical issues) is that they are really expensive and hard to conduct. They are very time consuming, and it is difficult and costly to recruit participants and get them to stick with the program. As a result, controlled trials generally range from a few dozen to a few hundred participants. Sample sizes of a few thousand are rare (though COVID provided a few exceptions).

This is a huge drawback, because sample size is one of the key factors dictating the power of a test. The larger the sample size, the more power you have to detect the thing you’re testing.

Background rates and the strength of the association also affect a test’s power and determine the sample size needed to detect an effect. Let’s say that you are testing a vaccine to see if it causes side effect X. If that side effect is really common, then you can detect it with a small sample size, but if it is really rare, then you are going to need a much larger sample size to detect it. Further, how often X occurs on its own (for reasons other than the vaccine) also influences your power. If it is really common in the general population, then it is going to be hard to detect the signal from vaccines causing it and, once again, you need a very large sample size. In contrast, if it is rare, then you can detect it with a smaller sample size.

This is where cohort and case-control studies come in. Cohort studies follow the same basic power rules as randomized studies, but because they are cheap and easy to conduct, they can be quite large, often including tens of thousands or even hundreds of thousands of individuals.

Case-control studies are even more powerful because they start with the outcome of interest. So even if the outcome is quite rare, you can get records for a lot of people with that outcome. This makes them substantially more powerful for studying potential causes of rare side effects, and these studies often have samples sizes of thousands of participants.

Simulated results

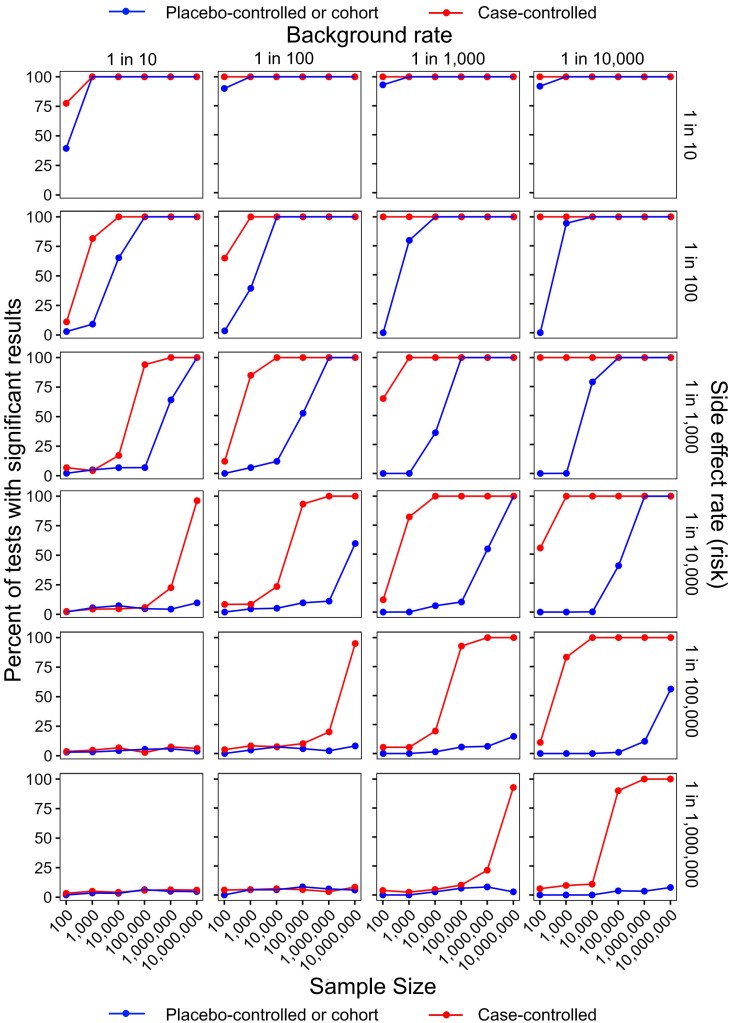
To illustrate this, I ran a simple simulation. In short, for a given sample size, background rate (how often it occurs without the potential cause), and side effect rate (how often the treatment actually causes it), it ran 500 iterations of generating populations of people who did and did not receive the treatment with the background rates and side effect rates applied. It then analyzed the data using the approach of randomized/cohort studies or case-control studies and returned the percent of “studies” (the 500 runs) where a statistically significant result was found (P < 0.05; see more details below).

I realize the resulting graph can be a bit daunting, so let me walk you through it. Going from left to right, the columns have decreasing background rates. So, in the first column, the outcome is very common in the general population (occurs in 1 in 10 individuals without the treatment), and on the far right, it is rare (1 in 10,000). Going down the rows, the side effect rate from the treatment decreases. So, in the first row, the side effect is very common (the treatment causes it in 1 in 10 patients, in addition to the background rate), and by the last row, it is rare, only being caused in 1 in 1,000,000 patients.

Within each panel, we are seeing the percent of tests (out of 500) where we were able to detect a correlation (significant result) on the y-axis. Keeping in mind that there was a causal relationship in each test. So, anything less than 100% indicates a false negative (an under-powered test). On the x-axis, we have increasing sample sizes (on a log10 scale). Blue results are for randomize/cohort trials, and red indicates case-control trials.

Simulation results comparing the power of randomized controlled trials/cohort studies and case-control studies. See text for details. Note that the x-axis is on a log10 scale, so each tick is 10 times the sample size of the previous tick.

There are several important and clear patterns here:

  1. Within each row, the rate of positive results increases from left to right (i.e., the lower the background rate, the more powerful the test).
  2. Within each column, the rate of positive results decreases from top to bottom (i.e., the rarer the side effect, the harder it is to detect).
  3. Within each panel, the rate of positive results increases from left to right (i.e., the larger the sample size, the more power).
  4. Case-control studies consistently have more power than randomized/cohort studies, with particularly pronounced differences for rare background and side effect rates.

Before going any further, I want to pause and stress that these are simulated results based on a simplistic scenario. So, the four trends described above apply to the real world, but the exact numbers shown here don’t necessarily apply, and in the real world there would be confounding factors (sex, age, medical history, etc.) that would be built into the models.

Interpreting the negative results

Now we get to a really important caveat about how to interpret negative results (keeping in mind that in my simulation, there was an effect of treatment in each simulation, we just weren’t always able to detect it).

Technically speaking, science never proves anything, and it is particularly problematic to demonstrate a negative. So, when we fail to find a correlation, technically, we have not shown that there is NO effect. Rather we have shown that IF there is an effect, it was too rare to detect with our sample size.

Keep in mind that in real studies, we know both the sample size and the background rate (that’s just the rate in the control group), so the only unknown is the treatment effect (side effect rate, in our example). Therefore, while we cannot conclusively with 100% certainty say that there is no relationship, we can get a sense for how rare it would have to be if it occurred. Thus, we can use the study design, sample size, and background rate to judge how concerned we need to be about the possibility of an undetectable effect. If the study had low power, then it may still be a legitimate concern, but if the study had a high power, then the concern is greatly reduced.

Note that anti-vaccers love to abuse this reality and play word games like demanding to see a study that “proves that vaccines don’t cause autism.” That’s an impossible request. It is never possible to prove that X does not cause Y, but we can show that if X causes Y, it would have to be doing so at such an incredibly low rate that it’s not a big concern (more on that in a sec).

Applying this to vaccines

Finally, let’s bring this all back around to anti-vaccers’ original argument that only placebo-controlled trials are satisfactory for establishing vaccine safety. As you can hopefully now see, that is a really faulty claim, and placebo-controlled trials are actually badly under-powered because of their low sample sizes. If you showed me a randomized, placebo-controlled trial of 1,000 children (a pretty big trial) that failed to find a significant trend for autism, I’d actually agree with you that that study is weak evidence. We know autism is fairly common (it has a high background rate), so that study would only eliminate the possibility of vaccines causing autism at a really high rate. It would still be entirely possible for vaccines to be a substantial cause of autism. That test was just under-powered.

In contrast, there have been several cohort studies of vaccines and autism with sample sizes of several hundred thousand children (Anders et al. 2004; Hviid et al. 2019; Madsen et al. 2002; Jain et al. 2015). Now we are talking about tests with some power; tests that can confidently assert that IF there is a relationship between vaccines and autism, it is a very weak one, and autism is a very rare side effect.

Further, we have case-control studies on vaccines and autism with hundreds or even thousands of children (Destefano et al. 2004; Smeeth et al. 2004; DeStefano et al. 2013; Uno et al. 2015). Again, those are actually very powerful (way more powerful than a randomized trial).

Additionally, there is even a meta-analysis that combined the studies above into one uber study with some truly impressive power (Taylor et al. 2014). Guess what? There was still no correlation. So, we can confidently state that there is no evidence of vaccines causing autism and IF they do, they are doing so at an incredibly low rate.

Stated another way, anti-vaccers are technically correct that we cannot “prove” that vaccines don’t cause autism, BUT we can and have demonstrated that even IF vaccines cause autism, the rate is very, very low. Thus, the notion of vaccines causing an “autism epidemic” is completely falsified. You almost certainly don’t know anyone who has autism because of vaccines because even if that side effect ever occurs, it is very rare.

Conclusion

I have been using autism as an example here, but all of this applies generally to all vaccines and all medical research using these study designs. When we are talking about safety and making claims about side effect rates, randomized placebo-controlled studies are often under-powered and frequently aren’t the best tool. They are great during initial testing, because they will detect common side effects and allow us to assign causation, but once we are talking about side effects that only occur once in a few thousand people, randomized trials are grossly under-powered, and cohort and case-control trials are much better tools for detecting correlation/associations. Randomization is important for assigning causation, but it is not needed to detect correlation, and while correlation does not indicate causation, two things that are causally related will, by definition, be correlated (though the correlation may be hard to detect). As such, anti-vaccers are completely and totally wrong to insist that we don’t know vaccines are safe without placebo-controlled trials. A lack of correlation/association in large cohort and case-controlled studies are great evidence that even if there was a side effect, it would be extremely rare. Thus, anti-vaccers are fundamentally misunderstanding how study designs and statistical power work.

NOTE ON LACK OF CORRELATION: When I say that a lack of correlation indicates a lack of causation, this is true in the strictest sense that if two things are causally related, there will inherently be a relationship between them. However, that does not mean that failing to detect a correlation proves a lack of causation. As seen in the post, tests may simply have been under-powered. Further, there may be time-lag effects or third causes that are also important. So, sample size and study design are important considerations (i.e., did they correctly control for confounding factors?). Nevertheless, my fundamental point remains that a lack of correlation/association in large cohort/case-control studies is good evidence that if there is a causal relationship, it is a weak one with a small effect size.

MODEL DETAILS: This was a stochastic simulation, meaning that there was chance variation in the results, which accounts for some of the “waviness” in the figure. For example, if the background rate was 1 in 10, then each individual in the control population, had a 1 in 10 chance of developing the outcome, but this was determined stochastically. So, for runs with 100 individuals, on average, 10 would have the outcome, but sometimes it would be 9, sometimes it would be 11, etc. Also note that the side effect rate was additive to the background rate, so if background = 1 in 10, and side effect rate = 1 in 10, people who received the treatment had a 2 in 10 chance of developing the side effect. Also note that sample size is per group. So, n = 100 means 100 people in the control group and 100 people in the treatment/case group. For modeling simplicity for the case-control trials, it assumed that half of the total population received the treatment.

Related posts

Litterateur cited

  • Anders et al. 2004. Thimerosal exposure in infants and developmental disorders: a retrospective cohort study in the United Kingdom does not support a causal association. Pediatrics 114:584–591
  • DeStefano et al. 2004. Age at first measles-mumps-rubella vaccination in children with autism and school-matched control subjects: a population-based study in metropolitan Atlanta. Pediatrics 113:259–266
  • DeStefano et al. 2013. Increasing exposure to antibody-stimulating proteins and polysaccharides in vaccines is not associated with risk of autism. J Ped 163:561–567
  • Hviid et al. 2019. Measles, mumps, rubella vaccination and autism: A nationwide cohort study. Annals of Internal Medicine.
  • Jain et al. 2015. Autism occurrence by MMR vaccine status among US children with older siblings with and without autism. JAMA 313:1534–1540
  • Madsen et al. 2002. A population-based study of measles, mumps, and rubella vaccination and autism. New England Journal of Medicine 347:1477–1482
  • Polack et al. 2020. Safety and efficacy of the BNT162b2 mRNA Covid-19 vaccine. New England Journal of Medicine 383:2603-2615.
  • Smeeth et al. 2004. MMR vaccination and pervasive developmental disorders: a case-control study. Lancet 364:963–969
  • Taylor et al. 2014. Vaccines are not associated with autism: and evidence-based meta-analysis of case-control and cohort studies. Elsevier 32:3623-3629
  • Uno et al. 2015. Early exposure to the combined measles-mumps-rubella vaccine and thimerosal-containing vaccines and risk of autism spectrum disorder. Vaccine 33:2511–2516

Posted in Nature of Science, Vaccines/Alternative Medicine | Tagged , , , , , | 5 Comments

Understanding analogies in logical arguments

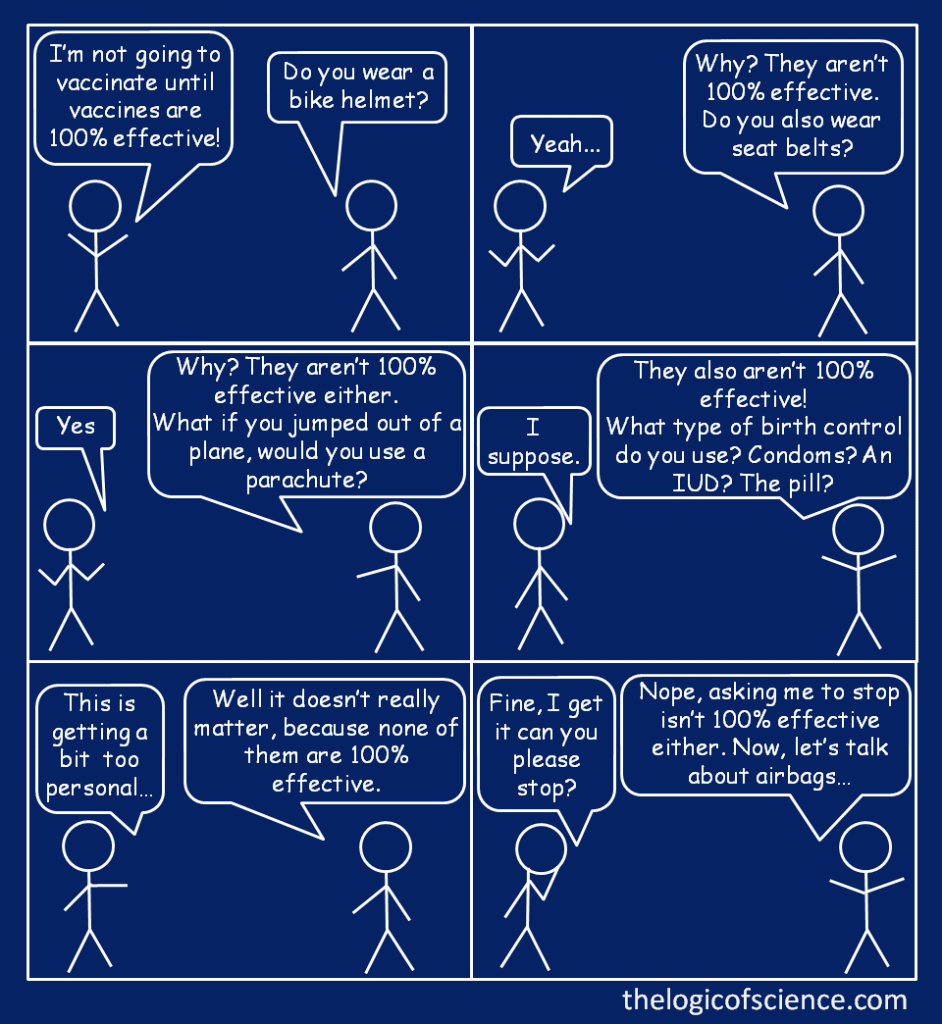
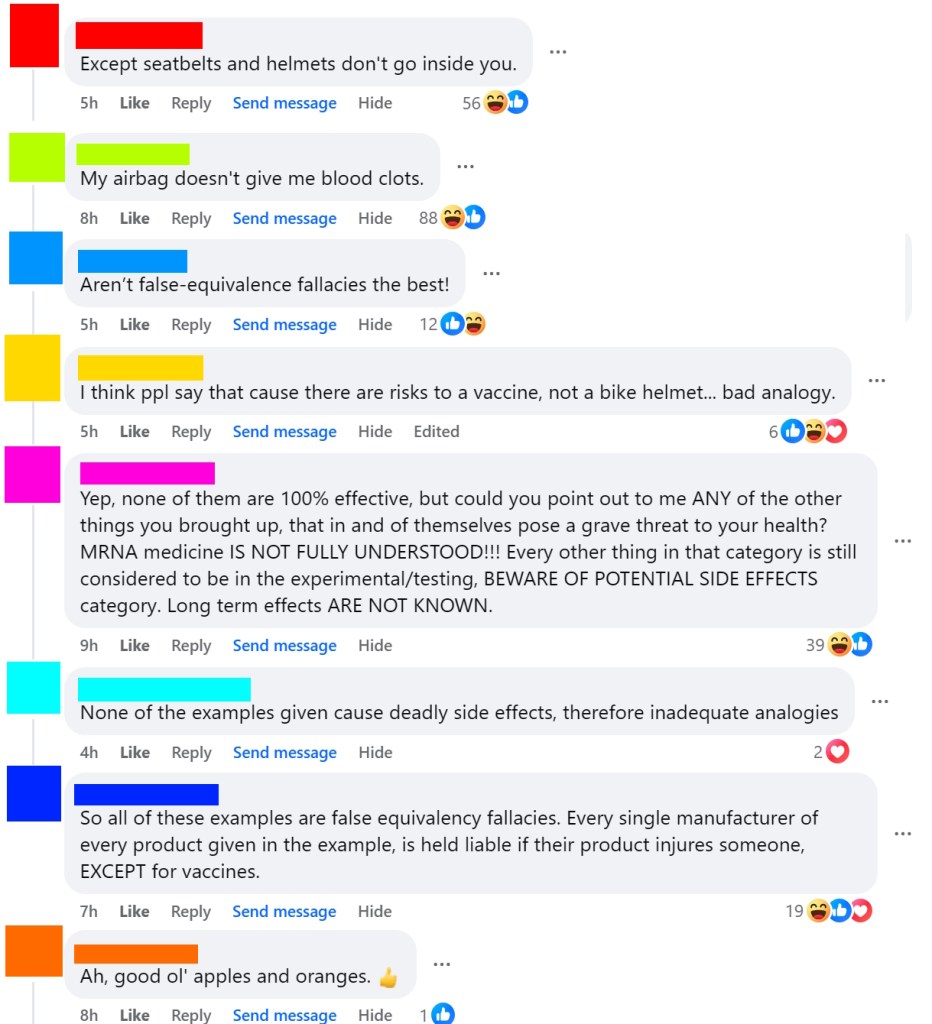
Yesterday, on this blog’s Facebook page, I posted the stick figure comic on the right, lightly making fun of anti-vaccers and using analogies to demonstrate why they are wrong that 100% effectiveness is needed for vaccines to be useful. I love analogies. They are a great way to get people past their biases and show underlying flaws in their reasoning, but apparently many people don’t understand how analogies work, and the comments quickly filled with people saying that these were bad analogies/false equivalencies because (according to them) unlike seat belts, helmets, birth control, or air bags, vaccines cause serious injury, go inside you, and are protected from lawsuits (see examples below).

There is a lot wrong with these responses (e.g., serious side effects from vaccines are extremely rare, serious injuries can occur from the other things mentioned, etc.), but I want to focus on the big one. Namely, these responses totally misunderstand the nature of analogies and how to evaluate arguments.

This comic was about one specific argument: the argument that vaccines aren’t useful because they aren’t 100% effective. That’s it. Effectiveness is the only thing being discussed. As such, all other considerations are 100% irrelevant. Even if vaccines were horribly dangerous (they aren’t) that would not make this comic a bad analogy or a false equivalency because it is not about safety. It is about the effectiveness argument. The purpose of a good analogy is to get at the underlying logical structure of an argument, and nothing outside of that structure matters.

To illustrate this, let’s break the argument down into its syllogism:

  • Premise 1: Vaccines aren’t 100% effective
  • Conclusion: Therefore, vaccines should not be used.

Stated like that, it is clear that the conclusion does not follow necessarily from the premises, which is why there is actually a second, unstated premise.

  • Premise 1: Vaccines aren’t 100% effective.
  • Premise 2 (unstated): Things that aren’t 100% effective should not be used.
  • Conclusion: Therefore, vaccines should not be used.

That is the argument being addressed by the comic, and we can show that the argument clearly does not work by replacing vaccines with literally anything else that is useful despite not being 100% effective. For example:

  • Premise 1: Seat belts aren’t 100% effective.
  • Premise 2: Things that aren’t 100% effective should not be used.
  • Conclusion: Therefore, seat belts should not be used.

Do you see how that works? All of those other considerations (like safety) are totally irrelevant for this analogy, because they don’t matter for this one particular argument.

To be completely clear, things like safety are certainly important in a broader discussion of vaccines. If I had said that this comic proves that we should be using vaccines, then commenters would have been absolutely correct to point out that it doesn’t address safety, but no one ever claimed that this comic encompasses all considerations or proves that we should vaccinate. It was about one specific argument about one specific aspect of vaccines, and the examples used are completely analogous for that specific aspect. Thus, it is in no way a false equivalency.

Understanding this is really important, because our brains are very resistant to information that is contrary to our beliefs, and one of the tricks they play on us is to ignore an argument we are being presented with and shift to a different argument. That is exactly what happened here. Rather than take the time to consider this one particular defect in anti-vaccer reasoning, people ignored the argument at hand and jumped to a different argument. We all tend to do this frequently, and it is a cognitive trap that we need to be aware of and train ourselves to avoid.

When presented with an argument, train yourself to avoid the tendency to jump to “what about…” Stop, take a deep breath, and carefully consider the argument currently in front of you. Don’t let your brain jump to other topics. Force yourself to focus on the specific argument you have been presented and thoroughly analyze it before moving on to other considerations.

My point with all of this is two-fold. First, try to understand what analogies are actually intended to do in logical arguments. Analogies are used to illustrate underlying defects in the structure of an argument. As such, only the factors relevant to that structure matter and all other considerations are irrelevant to the argument at hand. Even if two things being compared are wildly different in every respect except for the one thing being discussed in the argument at hand, it can still be a good analogy as long as the specific thing being addressed by the argument is the same. Second, train yourself to take each argument seriously and carefully on its own terms. Avoid the mental trap of jumping to other considerations that are irrelevant for the specific argument being discussed.

SIDE NOTE ON STRAW MEN: Another common response was to accuse me of committing a strawman. This comic is not a strawman, however, because on countless occasions I have seen people make this exact argument. Indeed, many years ago, one of my first popular blog posts was debunking a popular article called “One hundred arguments against vaccines.” The second argument in that list was “NO vaccine is 100% effective.” In the years since, I have seen people comment with this argument more times than I can count, though admittedly it is often stated less bluntly. For example, when you hear someone say something like, “being vaccinated doesn’t even guarantee that you won’t get infected!” They are making this argument. If you break that down into a syllogism, it’s the same logical structure, and we can use the same analogies, such as “wearing a helmet doesn’t even guarantee you won’t get a head injury!”

Further, in situations like this, many people make the strawman response simply because it is not their personal reason for holding a position. I see this all the time on topics like GMOs where, for example, I’ll post about pesticides and someone will say, “that’s a strawman because the real issue is corporate control of food.” Just because it isn’t the issue that you personally care about doesn’t mean it’s not an issue that others care about, and that doesn’t make it a strawman.

Related posts

Posted in Rules of Logic, Vaccines/Alternative Medicine | Tagged , , , , | 1 Comment

Stop blaming China and India for climate change

Over and over again when discussing climate change, I encounter Americans who insist that there is no point in doing anything because China and India are the real problem. This claim takes various forms but generally includes claiming that America’s emissions are tiny compared to China’s and India’s and that there is no point in the USA doing anything because countries like China and India will never change. When you start looking at the numbers and actually examining the facts, however, this argument utterly falls apart. It is simply a copout excuse for not taking action. I wrote about this several years ago, but the numbers have shifted since then, so it is time for an update.

At the start, I want to make it clear that I am not trying to “vilify” America or claim that countries like China don’t play a substantial role in climate change. There is plenty of blame to go around, and while China is taking action (more on that later), there is a lot more that they can and should do. However, America also plays a huge, outsized role in climate change, and it is disingenuous and dangerous to blame others rather than taking responsibility for our actions. All countries need to work together to solve this problem, but some countries (like the USA) have contributed an outsized proportion of the world’s greenhouse gas emissions.

With that said, let me outline some core points:

  • India produces far fewer emissions than the USA both in total and per capita. So, if you are claiming that India is worse than the USA, you are simply wrong on the facts.
  • China does contribute more than the USA in terms of total greenhouse gas emissions, but that is a fairly recent development and China lags way behind the USA in terms of per capita emissions.
  • China is building many new coal power plants and increasing their emissions, but they are also investing very heavily in renewable energy. So, the claim that they aren’t taking action is false.
  • Even if none of the points above were true, that would not absolve Americans of their duty to take responsibility for their own actions. “Other people were doing it too” has never been a valid excuse for unethical behavior.

Data source: For this post, I will be using: Crippa M., Guizzardi D., Pagani F., Banja M., Muntean M., Schaaf, E., Quadrelli, R., Risquez Martin, A., Taghavi-Moharamli, P., Grassi, G., Rossi, S., Melo, J., Oom, D., Branco, A., Suarez Moreno, M., Sedano, F. San-Miguel, J., Manca, G., Pisoni, E., Pekar, F., GHG emissions of all world countries – JRC/IEA 2025 Report, Luxembourg, 2025, https://data.europa.eu/doi/10.2760/9816914

Note: In this post, I am talking specifically about greenhouse gas emissions. Other topics such as plastic pollution and air quality in cities (e.g., the gases that cause smog) are separate issues that are irrelevant to the discussion at hand.

Total emissions over time

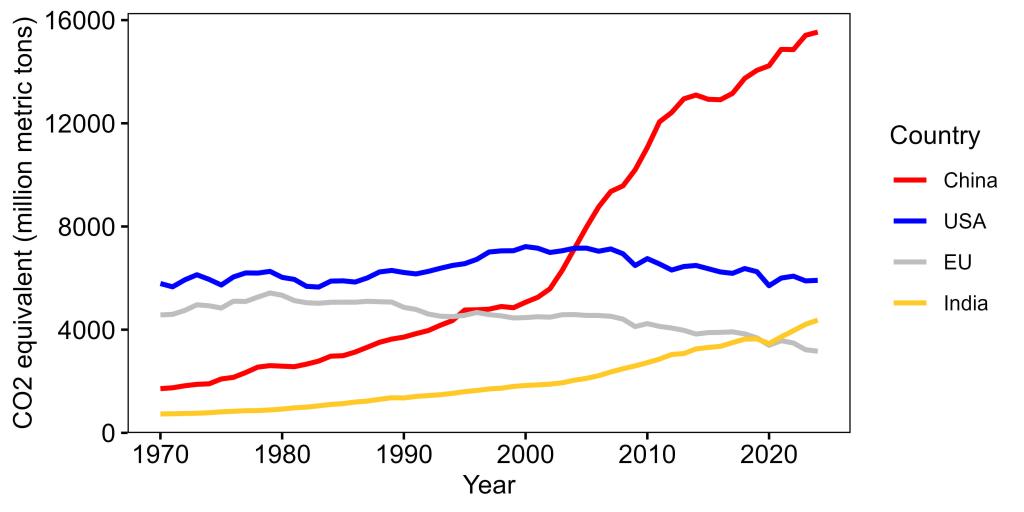
There are several ways we can look at the data, but let’s start by looking at total emissions over time. The three biggest emitters are China, the USA, and India, so I will focus on them while also including the countries currently in the European Union (EU) as a reference point (Figure 1). When we do that, several things become obvious.

First, China obviously has had a dramatic increase in greenhouse gas emissions. To that extent, there is some truth to the claim that they are having the biggest impact, but there are several other critical factors (like population size) that we have to take into account to get a full picture (more on that in a minute).

Second, shifting the blame from the USA to India makes no sense and is at odds with the facts. It is simply not true that India produces more greenhouse gases than the USA. Here again, India is admittedly increasing its greenhouse gas production, but as with China, there are other factors to consider (again, more in a minute).

Meanwhile, the USA has had a moderate emissions decrease since its peak in the 2000s, but it is still higher than its 1970 emissions level, whereas the EU has been consistently lower than the US, with a stronger decrease.

Figure 1: Greenhouse gas emissions per country from 1970 to 2024.

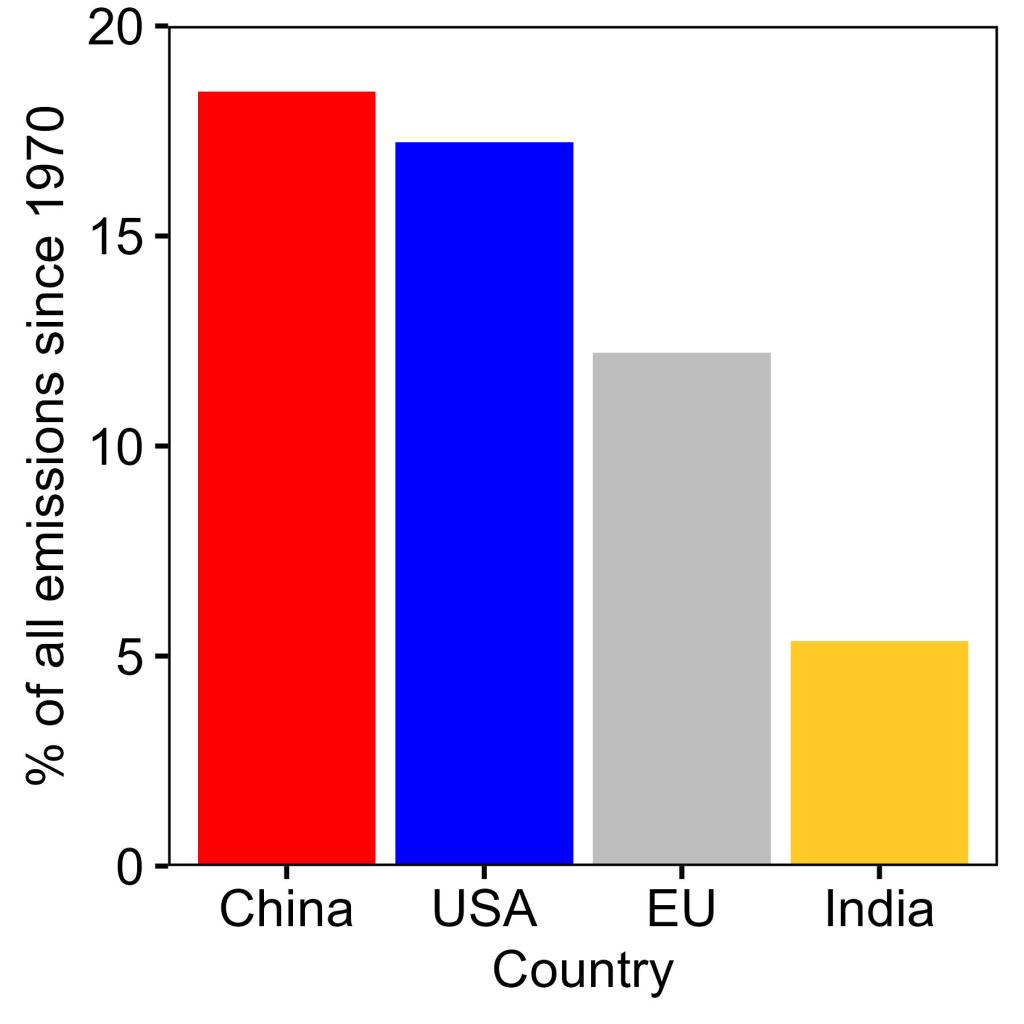
To really understand which countries have had the biggest role in climate change, however, we need to not simply look at the trends over time, but also at the total levels of contribution. So, let’s sum each country’s greenhouse gas emissions over time. When we do that (Figure 2), we find that India has actually only contributed 5.4% of the world’s total emissions. Meanwhile, China leads with 18.4% and the USA is only slightly behind at 17.2%. So, while China has produced more emissions than the USA, it is not even remotely true that they are the key polluter, and the USA is minuscule in comparison.

Figure 2: Percent of all of the world’s emissions from 1970-2024 produced by China, the United States of America, European unit (current countries), and India

Emissions per capita

So far, we have only looked at totals, but to get a complete picture, we have to look at emissions per person. Obviously, a larger country will be expected to produce more emissions.

Put another way, if two countries had identical environmental laws and regulations, but one country was twice the size of the other, we’d obviously expect the larger country to produce more emissions, even though the environmental policies were the same. That’s just simple math.

So, when looking at these emissions, we also have to account for the fact the USA is smaller than the EU and much smaller than India or China.

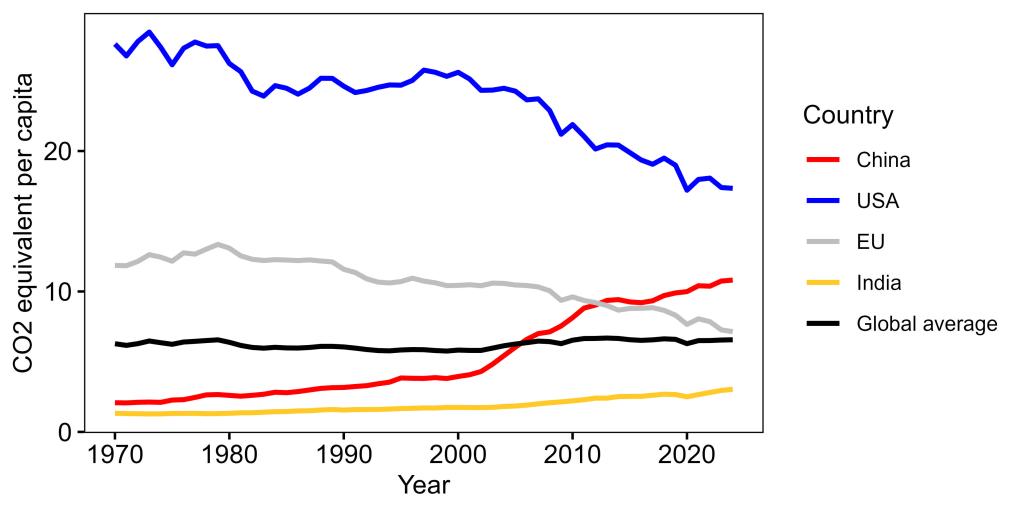
Looking at emissions per capita paints a very different story (Figure 3). For reference, I have included a line showing the global total emissions per capita (all countries combined). Any country above that line is contributing more than their fair share to climate change, while any country under that line is contributing less than expected based on population size. Compared to that line, the USA is an egregious offender. The emissions per capita are, fortunately, declining, but they are consistently way above the global average. Meanwhile, India consistently sits way below the global average, and the EU has declined to the point that it is just barely above the global average. China is, unfortunately increasing, but it has only recently risen above the global average and still lags well below the USA. Again, China’s increase is a problem, I’m not saying that it isn’t, but trying to place all the blame on China while ignoring the USA’s massive role is dishonest.

Figure 3: Emissions per capita for China, the United States of America, European unit (current countries), and India from 1970-2024. The per capita emissions for the entire planet are also shown as (“Global average”)

To put this another way, the USA has 4.2% of the world’s population but has produced 17.2% of the world’s total greenhouse emissions (since 1970). Meanwhile, China has 17.0% of the world’s population and has contributed 18.4% of total emissions. India lags way, way behind, with 17.7% of the world’s population, but only 5.4% of the world’s total emissions.

Stated yet another way, as of 2024 (the last year for which I have data), an average American produced 1.6x as many greenhouse gas emissions as someone in China, 2.4x as many as someone in the EU, and 5.7x someone in India! So don’t tell me that China and India are the “real” problem.

Again, I’m not saying that America is the only country to blame, but it is undeniable that it is playing an outsized role relative to its population size and it is silly and dishonest to pretend that other countries are the real problem. Further, all of this is before we even get into details like many of China’s emissions resulting from the production of products that are shipped overseas to satiate America’s rampant consumerism.

China is investing in renewable energy

Finally, while it is true that China is building more coal power plants, they are also one of the world leaders in investing in renewable energy. In 2024, China invested $625 billion in renewable energy, representing 31% of the world’s total investment (again, keeping in mind that they have 17.0% of the world’s population, thus representing an outsized investment). Indeed, in 2024, 84% of their electricity demand growth was met by their investment in renewables.

Here again, I’m not arguing that China is a shining example. Obviously, they still have a long way to go, and China is a massive contributor to climate change. However, it is completely dishonest to pretend that they aren’t taking steps to curb their emissions or that they are the “real” problem.

Americans often seem to think that the USA is the only country investing in fighting climate change and everyone else is to blame, but the actual facts and numbers paint a completely different picture. Even with China’s increasing fossil fuel use, its per capita emissions are still much lower than the USA’s, and China is investing heavily in renewable energy. The USA has contributed and continues to contribute a disproportionate amount of fossil fuel emissions and has a very, very long way to go before it can point fingers at other countries.

Posted in Global Warming | Tagged , | 4 Comments

Big pharma is not buying favorable peer-reviews

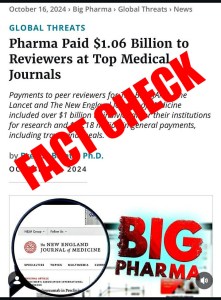
fact check, fact-check, fact-checking, industry funding, big pharma, debunkedScience-deniers have a long history of blindly assuming that any research they don’t like must have been corrupted by “big whatever,” and I constantly see people assume a study had conflicts of interest rather than actually checking for conflicts. Lately, a new strategy has emerged, with many people claiming that we shouldn’t trust peer-reviewed studies because “big pharma” is not only paying the authors, but also buying favorable reviews. This claim is based on a gross misreading of a short paper titled, “Payments by drug and medical device manufacturers to US peer reviewers of major medical journals” (Nguyen et al. 2024).

According to many of the commenters on my Facebook page (particularly anti-vaccers), this study proves that medical science is hopelessly corrupt and “big pharma” is just paying reviewers to get their papers through peer-review. When you actually read the study, however, it did not document anything even close to widespread corruption and, as always, science-deniers are simply revealing their own lack of scientific literacy. Indeed, if you understand the peer-review system at all, the claims being made are absurd on their face.

So, let’s quickly dig into how peer-review actually works, what this study actually found, and why the claims being made by science-deniers are completely bogus.

How peer review works in a nutshell

Before looking at this specific paper, we need to understand some basic concepts of how peer-review works. I have previously written several detailed posts about how peer-review works, who reviews papers, and how funding works in science more generally, so I’ll only hit the key points here.

First, peer-reviewers are active scientists with relevant expertise on the topic being studied in a give paper. Journals don’t have a staff of peer-reviewers. Rather, when a paper is submitted to a journal, the editor reaches out to relevant experts (i.e., other scientists) and asks them if they would be willing to review the paper. This process is generally completely voluntary, with reviewers getting, at most, free access to the journal for a limited period. For the vast majority of journals, scientists do not get paid for reviewing a paper. Rather, they volunteer their time.

The voluntary nature of peer-review already puts the claims of corruption on shaky ground, but let’s look further. Not only are the reviewers volunteers, but the authors of the paper have no way of knowing who the reviewers are going to be ahead of time, and for most journals, they are never told who the reviewers were even after review. For some journals authors can suggest potential reviewers, but it is entirely up to the editor which researchers they invite to review a paper, and authors have no way of knowing if their suggestions were followed. This is a devastating problem for the claim that “big pharma is buying reviews,” because there is no way for them to know who the reviewers are going to be. You can’t bribe someone if you don’t know whom to bribe.

Additionally, in most cases, there is another layer of removal between funding agencies (such as pharmaceutical companies) and the review process. Generally speaking, when a scientist receives funding for research, the funding agency has no input or control over the subsequent publications. If a researcher at a university receives a million-dollar grant from Pfizer to do a clinical trial, in most cases, Pfizer doesn’t get to control the resulting publication. Pfizer’s input into the study ends with approving the proposed research and sending the grant money. The scientist submits the paper for publication, not Pfizer.

Admittedly, that is painting with a broad brush as there are countless funding arrangements, and there are situations where companies have more control, particularly when we are talking about researchers working directly for the companies during the initial development phases of a drug, but once it gets to the later stages of clinical testing and, especially, studies after a drug is on the market, funders usually have little direct control over the output.

The paper

With that background now in place, let’s look at what Nguyen et al. (2024) actually found. Their methods were really simple and took a very crude, broad approach. First, they obtained lists of the names of all US-based researchers who served as peer-reviewers in 2022 for four major medical journals (The BMJ, JAMA, The Lancet, and The New England Journal of Medicine). Second, they looked at any industry payments those reviewers had received between 2020‒2022 and determined that 54% of reviewers had received some form of industry payment (1.07 billion dollars total).

To be 100%, crystal clear, these were not payments for peer-review; rather, these were payments made for any reason. So, as was sometimes the case, if a researcher was paid for a speaking engagement, then volunteered as a reviewer for one of these journals, that counted as a payment to a reviewer. Likewise, if someone did a study that was funded by a pharmaceutical company, then voluntarily reviewed a totally unrelated paper, that counted as a payment to a reviewer.

Thus, one of the key problems with the discussion around this paper is that it is often framed as if the payments were for review rather than being for totally separate reasons. Titles like, “Pharma paid $1.06 billion to reviewers at top medical journals” grab attention, but they are wildly misleading. A far more accurate title would be, “Reviewers at top medical journals also received $1.06 billion in unrelated funding.” (actually 1.07 billion)

As a brief aside, I know $1.07 billion sounds like a lot, but most of that (over 1 billion) was funding for research, the vast majority of which was paid to the researcher’s institution. When a scientist gets a 1 million dollar grant, a million bucks doesn’t show up in their bank account. Rather, it goes into a university/institution account, the university/institution takes a huge chunk as overhead, and the rest goes to buying equipment, paying research assistants, etc. (research is expensive). Very little if any goes to the researcher who received the grant (depending on whether they are responsible for funding their own salary). So, when you see those numbers, please remember that the money is generally not going directly to the scientists, and framing this paper as “payments to scientists” is actually highly misleading.

Getting back to the paper itself, an additional issue arises from the fact that “big pharma” is not a single entity. There are lots of different, competing pharmaceutical companies, but the study did not examine who was funding which study. In other words, this paper simply documented any reviewers that had received any industry funding regardless of whether the specific paper being reviewed was funded by the same company that provided the other funding.

As I have written about before (e.g., here and here), there are many studies that have no conflicts of interest and aren’t funded by pharmaceutical companies, but this paper in no way distinguished those studies. So, if a researcher received a grant from a pharmaceutical company, then reviewed a paper that did not receive funding from a pharmaceutical company, the payment to the researcher was still included, even though they were reviewing a non-industry paper. Similarly, a researcher who received research funding from Moderna then reviewed a paper that was funded by Pfizer was still included as an industry payment.

So even beyond the fact that these payments were not actually for peer-review, the level of existing conflicts of interest is not at all clear. The potential conflicts would only exist when a reviewer had received funding from the same company that had funded the paper, but those data aren’t presented, and by the time you consider all of the papers without and conflicts of interest and all of the different pharmaceutical companies out there, that number is going to be a very small portion of that 54%. In other words, the percent of reviewers who reviewed a paper that was funded by the same company that had previously paid them for something is going to by much, much smaller than 54%.

Note as well that this paper only documented the existence of unrelated payments to reviewers. It in no way assessed whether those payments biased reviewers, and even in the subset of cases where a reviewer’s funding and a study’s funding overlap, the idea that an anonymous, volunteer, peer-reviewer is going to be substantially biased in favor of a study because it was funded by a company that had previously given them funding is unlikely on its own. That’s just not how review usually goes.

Finally, even IF nothing else that I had said was true and pharmaceutical companies really were directly paying for favorable reviews (they aren’t), that would still only apply to 54% of reviewers (based on this study). So, if, for example, vaccines actually were dangerous, that would mean that the other 46% of reviewers should be shooting down pro-vaccine papers. The same is true more generally for conflicts of interest. If scientists only supported vaccines because of funding from big pharma, then there should be a clear schism with papers with and without industry funding coming to wildly different conclusions, and that’s just not the case.

In summary, this paper did not show that big pharma is buying favorable reviews, and it did not show that industry funding is biasing review results. It simply showed that reviewers often have work that receives industry funding (no duh).

Don’t misunderstand me, conflicts of interest can bias authors and should be taken seriously, but the crude level of analysis used in this paper doesn’t really add much of anything to the discussion and absolutely does not support the wild claims being made by the good people on the internet.


Posted in Nature of Science, Vaccines/Alternative Medicine | Tagged , , , , , , | 2 Comments

Is the “backfire effect” real?

The “backfire effect” is a psychological phenomenon in which correcting misinformation actually reinforces the false view rather than causing someone to reject it (Nyhan and Reifler 2010). This topic comes a lot in the comments on this and other pro-science pages. Sometimes it is presented as an argument that pages like this one actually do more harm than good, and other times it is brought up as a general point about how difficult it is to change people’s minds. Most of the commentary I see around this topic is, however, misleading at best. Ironically, many of the statements I see about the backfire effect are actually misinformation. The evidence for the backfire effect is actually pretty weak and mixed, and it may not even be a real effect at all. If it is a real effect, it is pretty clear at this point that it is not a wide-spread, generalizable effect that occurs anytime misinformation is corrected. So, in this post, let’s dig into the literature and see what the current state of evidence actually looks like.

Backfire effects are not widespread

The first critical point that many get wrong is that the data have never suggested that backfire effects are a widespread issue that happen anytime misinformation is corrected. A lot of times when I see people bringing up this topic, they act as if backfire effects are inevitable anytime you correct misinformation on any topic for any group of people. In reality, the studies documenting backfire effects have always found that they only apply to subgroups and certain topics. Indeed, the first study on backfire effects (Nyhan and Reifler 2010) only found them in 2 of the 5 topics they tested, and several years later, one of the original authors wrote an article (Nyhan 2021) in which they tried to set the record straight and bemoaned the fact that many media outlets had mischaracterized backfire effects and treated them as the dominant reason for the persistence of political misinformation.

To quote one of the original authors (Nyhan 2021),

“subsequent research suggests that backfire effects are extremely rare in practice”

Backfire effects have low reproducibility

If you read this blog often, you know that I spend a lot of time talking about the importance of looking for consistent evidence. There are publication biases towards positive results, a lot of low-quality papers do get published, and even for a perfectly conducted study, you may get a false positive just by chance. As a result, on essentially any topic, you can find papers arguing for it and papers arguing against it. Therefore, you should not cherry-pick studies and should instead look for a consensus of evidence. If an effect is real, studies should be able to document it with a reasonable degree of consistency. When it comes to backfire effects, the results are highly inconsistent.

There is a really interesting review on backfire effects that I highly recommend reading (Swire-Thompson et al. 2020). They found that, although this field looked really promising at first, a huge number of studies have failed to find evidence of the backfire effect, even when trying to directly replicate previous studies. For examples, see: Cameron et al. 2013; Garrett et al. 2013; Weeks & Garrett, 2014; Weeks, 2015; Ecker et al., 2017; Haglin, 2017; Swire, et al. 2017; Guess & Coppock, 2018; Nyhan et al., 2019; Schmid & Betsch, 2019; Swire-Thompson et al., 2019; Wood & Porter, 2019; Ecker et al. 2020; Ecker et al. 2021; Ecker et al. 2023. This lack of consistency occurs even in the subgroups/topics where researchers initially thought there were real backfire effects (also note that the authors of the original paper on backfire effects are authors on several of these papers that failed to find backfire effects).

In one of the largest and most comprehensive studies of this topic, scientists conducted five trails designed to approach the problem from slightly different ways. The trials covered a total 52 statements/corrections and included a total of 10,100 participants (Wood & Porter, 2019). They were not able to elicit a backfire effect for a single one of those 52 statements/corrections! Indeed, as with many of these studies, they found that correcting the misinformation resulted in an average improvement in scores. In other words, people updated their knowledge with the new information, and on average, their answers were more correct after the misinformation had been corrected (the opposite of a backfire effect).

All of this makes me extremely dubious about the backfire effect. If the effect is real, it should be reproducible, yet over and over again, the largest studies and replication studies fail to document backfire effects. So, let’s look closer at some of the factors that are going on here.

Study quality

One of the other things I talk about a lot is that study quality can vary slightly, and very often for topics where there is no effect, there is a negative correlation between study quality and the statistical significance of the outcomes. In other words, lower quality studies tend to produce positive results, but those effects disappear with larger, better controlled studies. This at least partially seems to be the case for backfire effects. As mentioned earlier, some of the largest studies (e.g.,  Wood & Porter, 2019) failed to find a backfire effect, but there is also an interesting trend when we look at response “reliability.”

Basically, “reliability” refers to whether studies are using questions that will give consistent results. In the Swire-Thompson et al. (2020) review, they pointed out that using only a single measure of agreement with a statement is often unreliable and can lead to false positives, and 81% of reported backfire effects relied on only a single measure. This suggests a large opportunity for false positives and raises serious questions about the majority of studies documenting backfire effects.

Swire-Thompson et al. (2022) took this further with a really elegant study that I recommend reading. In short, they used a test-retest procedure where they randomly split participants into treatment and control groups. The treatment groups where shown incorrect statements and asked to rate the truth of the statement. Then they were shown  corrections to the statement. Then they were retested three weeks later. Thus, if the backfire effect was occurring, they should rate the false statements as more true, on average, on the second test. The control group underwent the same procedure except they were not shown the corrections. This is a great design, because it let the authors use the control group to look at how reliable responses were across the 21 statements they used. They also ran the study twice to ensure results were repeatable (once with 388 participants and once with 532 participants).

There are a bunch of interesting results to this study (only some of which I have time to cover here). First, on average, the treatment group that was shown corrections updated their views more than the control group that was not shown corrections. In other words, again, the average effect was that people updated their views when shown fact checks (the opposite of a backfire effect). Second, in the treatment group, only 2 of the 21 statements showed any sign of a backfire effect (i.e., on average, people rated the false statement as more true after being shown the correct information), but neither was statistically significant. In other words, out of 21 tests across two trials, they did not elicit a single statistically significant backfire effect.

Taking this a step further, things get really interesting when we start looking closer at the patterns for the individuals who “backfired.” In other words, even though on average there was no backfire effect, there were some individuals whose scores suggested that they were more convinced of the false information after seeing the correction. This is where those reliability scores from earlier come in. Using the control group, the authors were able to measure the reliability of responses for each of the 21 statements, then look at how those reliability scores correlated with the level of backfiring in the treatment group. In other words, they used the control group (which was not shown fact checks) to see how consistently people rated the truth of each false statement, then they checked whether questions with a low consistency of responses in control group were more likely to have backfires in the treatment group. That is, in fact, exactly what they found: there was a strong negative correlation. In other words, the less reliable (repeatable) the responses to a statement were, the stronger the backfire “effect” was, thus strongly suggesting that measurement error is a big factor in studies reporting backfire effects. Indeed, in the two trials in this study, 37% and 53% of the variation in backfire effects was explained by the repeatability measures. That’s massive and provides a very plausible source of false positives in the broader literature.

The average effect of correcting misinformation is positive

Finally, it is worth explicitly pointing out that most of the studies I’ve been discussing have not only failed to find a backfire effect, but they have actually found a net improvement in scores after correcting the misinformation. In other words, the average effect of presenting fact checks is an improvement in peoples’ knowledge.

To again quote one of the researchers who originally described the backfire effect (Nyhan 2021),

“[There is an] emerging consensus that exposure to corrective information typically generates modest but significant improvements in belief accuracy.”

 and

“Contrary to media coverage of the backfire effect, subsequent research finds that people are often willing to revise mistaken beliefs when given accurate information.”

With that said, there is an important caveat. Saying that “the average effect is an improvement in belief accuracy” is not the same thing as saying “the average person will improve their belief accuracy.” In other words, these studies look at group effects, which don’t necessarily give a good reflection of what an average individual does.

As a hypothetical example, imagine we have a group of 100 people who believe the moon landing was fake, then we show them a fact check and 70 people remain unchanged, 20 update their views and accept the moon landing was real, and 10 dig in their heals and become more convinced it was fake. In that situation, the average score for the group as a whole will go up, showing that correcting the misinformation has a net benefit, but most individuals (70%) did not update their views, and a handful backfired (10%).

So, the key questions become, why did so few update their views, and where those 10 “backfires” measurement errors, or did encountering corrective information really make them more convinced of the false information (a true backfire)? Moving away from these group level effects and trying to understand factors for individuals is a promising approach and seems to be where the field is likely shifting.

Conclusion

So where does all of this leave the backfire effect? In short, to a large extent, it does not appear to be a real thing. It has never been generalizable, and it has only ever showed up for subgroups, but even for those subgroups, studies reporting backfire effects often can’t be replicated, numerous large, well-conducted studies have failed to find backfire effects, and the weight of evidence shows that the average effect of correcting misinformation is an improvement in the accuracy of peoples’ views (the opposite of a backfire effect). Further, studies reporting backfire effects often have low quality, and research has shown that a large portion of reported backfire effects are likely false positives due to low reliability of the questions being asked. So, if the backfire effect is real, it is very rare and is probably related to very specific individual-level traits that are not currently well understood.

Therefore, the backfire effect should not be used as a reason for not correcting false information. The data show that, on average, fact checks do more good than harm.

Literature cited

  • Cameron et al. 2013. Patient knowledge and recall of health information following exposure to “facts and myths” message format variations Patient Education and Counseling 92:381-387
  • Ecker et al. 2017. Reminders and repetition of misinformation: Helping or hindering its retraction? Journal of Applied Research in Memory and Cognition 6:185-192
  • Ecker et al. 2020. Can corrections spread misinformation to new audiences? Testing for the elusive familiarity backfire effect. Cognitive Research: Principles and Implications 5:41
  • Ecker et al. 2021. Corrections of political misinformation: no evidence for an effect of partisan worldview in a US convenience sample. Philosophical Transactions of the Royal Society B, 376:20200145.
  • Ecker et al. 2023. Correcting vaccine misinformation: A failure to replicate familiarity or fear-driven backfire effects. PLoS ONE. 18(4): e0281140.
  • Garrett et al. 2013. Undermining the corrective effects of media-based political fact checking? The role of contextual cues and naïve theory. Journal of Communication, 63:617-637
  • Guess and Coppock. 2018. Does counter-attitudinal information cause backlash? Results from three large survey experiments. British Journal of Political Science 2018:1-19
  • Haglin. 2017. The limitations of the backfire effect. Research & Politics 4.
  • Nyhan and Reifler. 2010. When corrections fail: The persistence of political misperceptions. Polit. Behav. 32:303–330
  • Nyhan 2021. Why the backfire effect does not explain the durability of political misperceptions. PNAS 118:e1912440117
  • Nyhan et al., 2019. Taking fact-checks literally but not seriously? The effects of journalistic fact-checking on factual beliefs and candidate favorability. Political Behavior 2019:1-22
  • Schmid & Betsch. 2019. Effective strategies for rebutting science denialism in public
  • discussions. Nature Human Behaviour, 1
  • Swire, et al. 2017. Processing political misinformation: Comprehending the Trump phenomenon. Royal Society Open Science 4
  • Swire-Thompson et al., 2019. They might be a liar but they’re my liar: Source evaluation and the prevalence of misinformation. Political Psychology 41: 21-34
  • Weeks, 2015. Emotions, partisanship, and misperceptions: How anger and anxiety moderate the effect of partisan bias on susceptibility to political misinformation. Journal of Communication 65:699-719
  • Weeks and Garrett, 2014. Electoral consequences of political rumors: Motivated reasoning, candidate rumors, and vote choice during the 2008 U.S. Presidential Election. International Journal of Public Opinion Research 26:401-422
  • Wood and Porter. 2019. The Elusive Backfire Effect: Mass Attitudes’ Steadfast Factual Adherence. Political Behavior 41:135–163
Posted in Uncategorized | Tagged , | 6 Comments