 The notion that there has been a recent pause or hiatus in global climate change is one of those myths that just will not die. Numerous studies have shown that it simply isn’t true, and the claim is based on cherry-picked evidence and shoddy statistics. Nevertheless, despite 2015 replacing 2014 as the warmest year on record (based on surface temperature data), the myth lives on. Therefore, I want to provide a simple explanation of why this argument is fraudulent, as well as briefly reviewing several fairly recent studies that have thoroughly demolished the myth of the global warming pause. In short, the “pause” is actually just a normal fluctuation, and there have been multiple similar “pauses” prior to this one. There is nothing truly unique or special about the past two decades, and the climate is still warming.
Cherry-picked dates
Before I talk about the climate data itself, I need to make a few general points about analyzing trends. Generally, when you want to see if something is changing over time, you are going to do a regression analysis to see if there is a significant change in the variable of interest as time progresses (i.e., does it increase or decrease over time). Whether or not you get a significant trend is, however, highly dependent on the dates that you use, and it can be skewed by either starting or ending on an extreme year. This means that for almost any large data set, you can cherry-pick some subset of the data which fits your preconceived view.
These are fictional data intended to show what happens when you cherry-pick your starting point. The top panel is statistically significant, whereas the bottom panel is not.
Let me use the following fictional data set to illustrate this (right). I deliberately left the Y axis blank so that you can pretend that these data are whatever you want them to be (net earnings, population size, temperature, etc.). When we look at the full data set, we can clearly see that there is an overall upward trend, and we get a statistically significant increase over time (P < 0.001; I explained P values in detail here, but for now just realize that anything less than 0.05 is typically considered to be statistically significant). Nevertheless, if we cherry-pick our starting point, we can create the illusion of a pause. For example, you’ll notice that 1998 was a particularly high and unusual year, and if we use that as our starting point, we find that there has not been a statistically significant increase since that time (P = 0.717). If we start with 1999, however, we find a significant increase again (P = 0.013). In other words, if you deliberately start with an unusual year, you can mask the overall trend (which, in my book, is fraudulent).
The example above is obviously extreme because 1998 was such a huge outlier, but we can do the same thing with less extreme situations. Consider, for example, that if we cherry-pick the years 1990–1997 we get a fairly flat, non-significant line (P = 0.8694). Similarly, if we start with 2003 and go through 2015, we get a non-significant result of P = 0.061. Further, let’s imagine that it was currently 2010, so you only had the data going up to 2009. In that case, if you started with the 2003 data, you would actually find a significant negative trend (P = 0.004) even though the overall trend is clearly a positive one.
My point here is simply that you can tell almost any story that you want if you cherry-pick your data carefully enough. There will always be natural fluctuations in the data, so if you cherry-pick where you start your analysis, you can twist the data to fit your preconceptions. Doing so is, however, completely inappropriate, yet it is exactly what has happened with the climate data. The people who claim that global climate change has paused nearly always start the pause in either 1997 or 1998 even though we have data going back much further than that. Why do they use those years? Quite simply, because those are the years that fit their story. 1998 was an extremely strong El Niño year, which made it unusually warm. This is particularly pronounced in the satellite data, which is typically the data set that I see people citing as evidence of a pause. Thus, just like 1998 in my fictional example, starting the climate trend in 1998 biases the analysis. In fact, if we start in either 1996 or 1999, we find a significant warming trend (P = 0.047 and 0.021 respectively). So why should we say, “there has been no warming since 1997” when we could also say, “there has been significant warming since 1996” or “there has been significant warming since 1999”?

Short term data are unreliable if you are interested in long term trends. As a result, if you cherry-pick your years, you can find quite a few “pauses” in climate change. Image via Skeptical Science. Note: some people have claimed that Skeptical Science cherry-picked their data set for the fourth flat section, but that is irrelevant since the entire point of this image is to illustrate that you shouldn’t cherry-pick data because you can misrepresent it by doing so (i.e., climate change contrarians cherry-pick data all of the time, and this image shows why that is a bad idea).
In fact, any starting point prior to 1997 is significant, and there are multiple significant starting points after 1998 (from both the RSS data and NASA’s surface temperature data set). Similarly, Skeptical Science put together a great image (left) for a surface temperature data set showing that if we cherry-pick our years, we can find many “pauses” despite the clear overarching trend. In other words, our current “pause” is nothing more than a natural fluctuation, and it is in no way unique.

This shows the temperature data once the effects of El Niños, solar fluctuations, and volcanoes have been removed. Image via Open Mind.
Nevertheless, even though you have to cherry-pick to see a hiatus, it is true that starting the trend in either 1997 or 1998 will give you a flat line (using the satellite data), and some people are understandably bothered by that, so let’s look at it a bit further. Part of the issue is sample size. The smaller your sample size, the harder it is to detect trends (which is also a big part of why the Skeptical Science figure was able to produce so many flat lines). The second and probably more important reason is that there are many factors that influence the climate (output from the sun, volcanic activity, El Niños, etc.) and cause natural fluctuations. These factors create noise that can make it difficult to see changes over the short-term. In other words, over long periods of time, the impact of human activities has a strong enough effect that it is obvious, but over short periods of time, human-induced changes can be masked by natural factors. To illustrate this, look at what happens to the data when we account for the natural factors (figure above and Foster and Rahmstorf 2011). The RSS and UAH data sets are the same satellite data sets that are generally used to show a flat line starting in 1997/1998, but when we account for the natural factors, suddenly, clear warming patterns emerge, even if we look at 1997/1998 and use it as our starting point (i.e., as we remove natural factors, the influence of human activity becomes more clear).
Cherry-picked data sets
A second major problem with the claim that there has been a pause in climate change is the choice of data set. You see, the term “global warming” is somewhat misleading. Yes, the average temperature of the planet has and will increase, but there is a lot more happening than just the temperature changing, and we should really be more concerned with the total amount of heat energy that the earth is trapping, rather than changes to the surface temperature. This is why most scientists prefer the more accurate term “global climate change.”
Because climate change involves a lot more than just the surface temperature changing, there are multiple data sets that we could use to look at it, such as land surface temperatures, ocean surface temperatures, lower atmosphere temperatures (which is what satellites record), and deep ocean temperatures. All of these should ultimately be affected by climate change, but not necessarily at the same rates. Satellite readings are, for example, particularly sensitive to the effects of El Niños. Also, water has a high heat capacity, which means that the oceans will absorb heat energy far more readily than the earth’s surface.
Therefore, if climate change has actually halted, it should be reflected in all of the major data sets, but it’s not. In other words, there is nothing in the science of climate change that says that all areas of the earth will be warmer all of the time. Rather, different components of the earth will warm at different rates, and some may even cool. So we don’t actually expect every year to be warmer than the last across all of the data sets. If it has truly paused, however, then you should not see trends of increasing temperatures in any of the data sets.
So what do the data sets actually show? For a while, there was no statistically significant increase from either the satellite data or the surface data, but as time has progressed, that has changed, and if you look at NASA’s global Land-Surface Air and Sea-Surface Water Temperature Anomalies data set, you will find a significant increase no matter what year you start the analyses in (note: that is only true if you use each month as a data point, if you use the yearly means, then it is significant for any starting point prior to 2005, after that you start to loose significance, largely because of the small sample size). Further, many of the previous analyses of the surface data sets failed to account for methodological changes and reached incorrect conclusions as a result (more on that later).
Meanwhile, the satellite data for the lower atmosphere (such as the RSS data) do show a flat line for some starting points within the past two decades. As I noted earlier, however, there are also years that yield a significant increase. Further, as noted in an earlier figure, once your correct for natural factors, the warming trend becomes obvious. Additionally, there is some debate among scientists about how reliable the satellite data actually are (Weng et al. 2014). The situation is extremely complicated, so I’m not going to attempt to explain it in detail in this post, but in short, satellites don’t actually measure the temperature. Rather, they measure several wavelengths of radiation and use those measurements to infer the temperature. The problem is that particulates and various gasses can interfere with those radiation measurements. Also, satellites tend to drift over time, which makes it hard to get long term measurements from a fixed point. To be clear, I’m not suggesting that the satellites are worthless, rather I am just pointing out that they have clear limitations and elevating them to the status of irrefutable evidence while ignoring the other data sets makes no sense whatsoever.
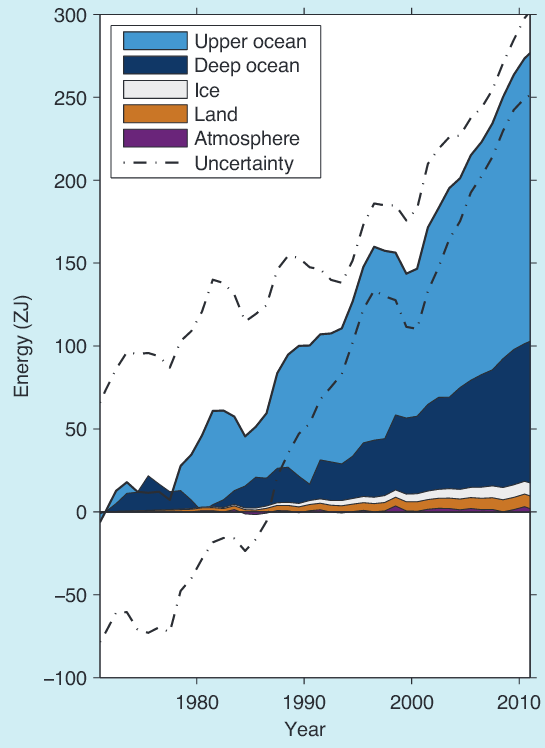
The accumulation of energy over time. You’ll notice that most of the energy is getting trapped in the oceans. Image via Rhein et al. 2013.
Finally, let’s turn to a very important source of data: the oceans. Our oceans are massive heat sinks. Indeed, it’s estimated that over 90% of the excess energy that the earth has trapped via global warming is stored in the oceans (Rhein et al. 2013). This is because water has a very high heat capacity, which makes it excellent at absorbing and storing heat energy. So, what’s happening to our oceans? Quite simply, they are trapping more heat energy (Balmaseda et al. 2013; Glecker et al. 2016). Look, for example, at Figure 1 in the Balmaseda et al. study or Box 3.1 (page 262) of Rhein et al. (2013)(left). Yes, there are fluctuations, and in Balmaseda et al. you can see a large peak around 1998 (just like all of the other data sets), but there is also a very clear upward trend. In other words, the oceans are continuing to trap more and more heat.
In short, there are many different data sets that we could use to ask whether or not the climate is still changing, and only the satellite data show any indication of a pause, and even then, the pause is only present if you cherry-pick your dates and fail to correct for confounding factors. As I frequently argue, we have to look at all of the data, not just the subset that conforms to our preconceptions, and when we do that, it is very clear that the planet is still warming.
Scientific analyses show that there is no pause
At this point, I have attempted to explain the statistical problems with the claim that there is a pause, but I clearly don’t expect you to take a blogger’s word for it (even though I am also a scientist). I do, however, expect you to accept results from the peer-reviewed literature. Several research groups have looked at the data to see whether or not the recent “pause” is actually unusual, and they have all reached the same conclusion. Namely, there are large natural fluctuations in the earth’s temperature, and, as a result, if you cherry-pick subsets of years, you can find numerous “pauses,” but those simply represent normal fluctuations, not actual hiatuses in climate change (this is the same thing that the Skeptical Science image shows; Easterling and Wehner 2009; Santer et al. 2011; Lewandowsky et al. 2015a; Lewandowsky et al. 2015b). In other words, the fact that (according to some data sets) the earth’s temperature has not risen significantly in recent years is not actually an indication that global warming has slowed or is no longer happening.
Further, Karl et al. (2015) found that the surface temperature data sets had numerous biases resulting from inconsistent methodologies, and once those biases were removed, the data showed that the rate of climate change over the past 15 years is just as great as the rate in the preceding decades. People often have a knee-jerk response to statements like that and say, “see, they are committing fraud and manipulating the data to make it show warming,” but that’s not what is happening here. You can find a really great, thorough explanation of why the data have to be adjusted here, so I’ll just give you the Cliff Notes version (I also previously wrote a post that was specifically about adjustments in the GHCN data set). In short, climate data have been collected for decades from all over the world using many different methodologies, and those methodologies and collection locations have changed over the years. Those differences and changes create biases in the data that have to be accounted for. These types of corrections are normal for real data sets, and failing to make them will give you incorrect results
Let me give one really simplistic explanation to illustrate why adjustments are necessary. Let’s say that you have been recording the temperature in your back yard for years, and originally the thermometer was in an open area. Over time, however, a large tree has grown and now shades the thermometer. If you don’t account for the presence of that tree, you are going to get an incorrect cooling trend. The same type of thing happens with real data, and we have to account for any biases and changes in the collection methodologies if we want accurate trends. There is nothing dishonest or fraudulent about that.
In blind tests, experts and non-experts reject the idea of a pause
People are obviously prone to biases, and when looking at something like a temperature data set, your biases can cause you to see a pause that isn’t there or make you ignore a pause that is real. Some studies have, however, overcome this problem by doing blind tests. In other words, they present people with the data and ask them to determine whether or not there has been a recent pause, but they don’t tell them that the data are climate data, thus eliminating the biases. These studies have found that once the biases are eliminated, people don’t detect a pause (sometimes they don’t detect a pause even with the biases).
The first of these is not actually a peer-reviewed study, but it is nevertheless informative. In 2009, The Associated Press sent two temperature data sets to four different professional statisticians, and asked them to look for trends and determine whether or not there has been a recent pause, but they did not tell the statisticians that the data sets contained climate data. All four of them said that there was no pause. In other words, when professional statisticians unbiasedly examined the data, they did not detect a hiatus.
The next study was actually peer-reviewed and was conducted by Lewandowsky (2011). This study did not use experts, but instead showed long term climate data to 200 pedestrians and asked them to predict the next three data points. Half of the people were told that the data were share prices, and the other half were told that they were climate data. Interestingly, both groups predicted that the next three points would increase, even if the subjects didn’t think that humans were causing the climate to change.
The final study was also conducted by Lewandowsky (2015b), but it used experts instead of non-experts. It did not, however, use climatologists. Rather, it used economists. This may sound strange at first, but it actually makes good sense because both groups are adept at analyzing trends and making predictions about future events based on those trends. All 25 participants had at least a master’s or Ph.D. in economics or a relevant field, and all but four of them had at least five years of professional experience. They were shown the climate data, but they were told that the data were for the world’s agricultural output and they were asked to analyzed the data in light of the following statement,
“A prominent Australian critic of conventional economics, Mr. X., publicly stated in 2006, that ‘There IS a problem with the growth in world agricultural output—it stopped in 1998.’ A few months ago, Mr. X. reiterated that ‘. . . there’s no trend, 2010 is not significantly more productive in any way than 1998.’”
Finally, they were asked several questions about whether or not the data supported that statement. The majority of them did not think that the data supported that statement, and almost two-thirds of them went as far as saying that the claim may be fraudulent.
All three of these tests tell the same story: the data do not actually support the notion that climate change has paused, which implies that people are latching onto the idea of a pause for ideological reasons rather than scientific ones.
Conclusion
In summary, if you want to claim that the earth is no longer warming, you are going to have to violate numerous principles of both scientific and logical investigation. First, you have to cherry-pick your data set and focus on the satellite data even though the surface and ocean data sets show clear evidence of continued climate change. Then, you are going to have to cherry-pick within those data sets to select the years that match your preconceptions, while simultaneously failing to account for factors such as El Niños and volcanoes. You will also have to ignore the expert analyses of the data which found that there was no pause, and you will have to ignore the fact that there have been multiple other similar “pauses” in the past.
In short, global warming has not paused. The past two decades simply represent normal fluctuations, not a hiatus. So please, I beg of you, stop claiming that climate change is no longer happening, because that claim simply isn’t supported by the data. It is happening, and it will continue to happen until we finally decide to take serious action.
Note: I can already hear the keyboards clicking away as people misuse my statements about “natural fluctuations” to assert that climate change itself is just a natural fluctuation. So let me be clear, that claim is in no way shape or form justified. The overall trend is far, far greater than what is caused by natural fluctuations (over the given time frame), and we are extremely certain that we the cause of the current warming.
Other posts on climate change:
- 25 myths and bad arguments about climate change
- Basics of Global Climate Change: A Logical Proof That it is Our Fault
- Do we need more studies on vaccines, GMOs, climate change, etc.?
- “Follow the money”: the finances of global warming, vaccines, and GMOs
- The GHCN Temperature Adjustment Myth
- Yes, there is a strong consensus on climate change
Literature Cited:
- Balmaseda et al. 2013. Distinctive climate signals in reanalysis of global ocean heat content. Geophysical Research Letters 40:1754–1759.
- Easterling and Wehner 2009. Is the climate warming or cooling? Geophysical Research Letters 36.
- Foster and Rahmstorf 2011. Global temperature evolution 1979–2010. Environmental Research Letters 7:011002.
- Gleckler et al. 2016. Industrial-era global ocean heat uptake doubles in recent decades. Nature Climate Change.
- Karl et al. 2015. Possible artifacts of data biases in the recent global surface warming hiatus. Science 348:1469–1472.
- Lewandowsky 2011. Popular consensus climate change is set to continue. Psychological Science 22:460–463.
- Lewandowsky et al. 2015a. On the definition and identifiability of the alleged hiatus in global warming. Scientific Reports 5: 16784.
- Lewandowsky et al. 2015b. The “pause” in global warming: Turning a routine fluctuation into a problem for science. Bulletin of the American Meteorological Society
- Rhein et al. 2013. Observations: Ocean. In: Climate Change 2013: The Physical Science Basis. Contribution of Working Group I to the Fifth Assessment Report of the Intergovernmental Panel on Climate Change. Stocker (eds.). Cambridge University Press, Cambridge, United Kingdom and New York, NY, USA
- Santer et al. 2011. Separating signal and noise in atmospheric temperature changes: The importance of timescale. Journal of Geophysical Research: Atmospheres 116.
- Weng et al. 2014. Uncertainty of AMSU-A derived temperature trends in relationship with clouds and precipitation over ocean. Climate Dynamics 43:1439–1448.