Winning the war with the “Food Babe Army”

Spongebob squarepants sandy cheeks, science makes everything sound painfulOver the past week, something truly amazing has happened on the internet. The skeptic community has risen up and unanimously decried the quackery and fear mongering that constantly spews from Vani Hari’s mouth (and website). Vani Hari, better known as the, “Food Babe” has been scrutinized by scientists and skeptics since her initial internet debut, and, truth be told, it’s not hard to find fault with her arguments. Her entire world-view centers on the notion that chemicals with long scary sounding names must be bad for you, and she at least claims to live by the credos that if you can’t pronounce something you shouldn’t eat it and, “there’s just no acceptable level of any chemical to ingest, ever.” The reality is, of course, that such statements ignore high school level chemistry and are nothing more than appeal to nature/appeal to emotion fallacies. All matter is made of chemicals, and the length of a chemical’s name has nothing to do with whether or not it’s toxic. For example, everyone should regularly consume retinal, ascorbic acid, cyanocobalamin, and cholecalciferol. Those names are hard to pronounce and sound frightening (after all one of them is an acid, it must be toxic!), but those of us with scientific knowledge (or Google) know that those are simply the chemical names for vitamins A, B, C, and D.

Nevertheless, skeptics have devoted a considerable amount of effort to debunking her nonsense. Blogs like Science Based Medicine, Neurologicablog, and many others have done a phenomenal job of thoroughly shredding her claims that there’s antifreeze in beer, microwaves destroy the nutritional value of food, Subway is feeding you yoga mats, etc. Meanwhile, the blog Bad Science Debunked has been busy pointing out the fact that she sells numerous products that contain the very same chemicals that she decries!

The problem is, that despite the obvious absurdity of her claims (let’s not forget that she was concerned by the fact that airplanes don’t contain 100% oxygen even though the air you normally breathe is mostly nitrogen), people have flocked to her message of scientific illiteracy. She has amassed a “Food Babe Army” which wages war against any chemical which she finds unappealing. This would all be laughable if it wasn’t for the fact that her army actually accomplishes many of its goals! Most famously, they succeed in getting both Craft and Subway to remove chemicals that the Food Babe, armed with her degree from the University of Google, had decided were toxic.

This has concerned me for some time now. Despite the fact that a high schooler could defeat her “science,” her army was growing, and the rational voices of the skeptic community seemed to be falling on deaf ears. All of that may have changed, however, on April 7, 2015. That is the day which, I hope, will be remembered as the turning point in the war with the Food Babe Army, because that is the day when the “Science Babe” took down the “Food Babe” in arguably the most epic rant to date. I am, of course, referring to the Gawker article which quickly went viral. There was a lot of build up to that article (such as the New York Times article which was less than kind to Hari), but (at least in my observations) the Gawker article seems to have been a tipping point. In the few days since that article, I have seen numerous skeptic blogs writing additional takedowns, which have been heaping wood onto the growing fire that is decimating her position. In addition to posts about her scientific illiteracy, others have taken issue with her debate tactics, such as the fact that she dismisses many critics by simply accusing them of being sexist. Other people have been resurrecting some of Hari’s old Twitter posts, such as the patently absurd claim the flu vaccine was used to carry out genocides.

The Food Babe has, of course, responded to this new wave of criticism, but in many ways her response only weakens her position. Rather than actually deal with the fact that her views aren’t grounded in science, she has resorted to her normal brand of ad hominem name calling and shill accusations. To any unbiased observer, it’s pretty obvious that the Science Babe won this round.

With all of these new posts appearing in my newsfeed, I wondered just how much of an impact all of this was actually having. So, I turned to Google Trends and searched for “Food Babe.” The result was the figure below. That massive spike at the end is entirely from the first 10 days of April. The internet is lighting up with searches about Vani Hari.

food babe

This is a screen shot of Google Trends showing searches for “Food Babe.” That last peak is entirely from the first 10 days of April (this image was taken on April 10, 2015)

It has been said that “any press is good press,” but I tend to disagree. I think (or at least hope) that this massive push against Food Babe’s nonsense will have a positive impact. Encouragingly, her Facebook following has actually decreased this week! Granted, it has only been a decrease of 0.2%, but still a decrease is a decrease, and it’s an encouraging early sign. Nevertheless, I have accepted that we will probably never convince most people to defect from the Food Babe Army. Most of those poor souls have been trapped by Hari’s spell; however, I have great hope for those who have not yet converted to her pseudoscience, and I think that this massive assault on her arguments may go a long way towards stopping the growth of her empire. Her army is never going to go away, and her nonsense will always clutter the internet, but just maybe, we can stop her following from growing, or at the very least, slow it down. To quote one of my heroes (Captain Jean Luc-Picard), “The line must be drawn here. This far, no further!

food babe stats

Facebook allows page moderators to see basic stats of other pages (such as their percent growth from week to week). This is a screen shot of Food Babe’s percent growth from the previous week, taken on April 11, 2015. You’ll notice that the growth rate is negative (indicated by the color red and the downward arrow). This is the first time that I have ever checked a page’s stats and seen a negative “growth.”

To be clear, I am not encouraging anyone to use ad hominem assaults against Vani Hari. Sexist comments and personal attacks against her are unnecessary and inappropriate. Rather, I am simply trying to express my undying gratitude to the blogging warriors who have done battle with the Food Babe Army for the past several years. Thanks to their efforts, we have finally arrived at a point where I am optimistic that we might actually have a legitimate chance of stopping the spread of her quackery. So, I encourage anyone reading this not to let up. We need to keep pointing out her many errors until everyone comes to the realization that her arguments are based on fear not facts. This is not a war about what’s in our food, its a war about whether we are going to accept science or fall prey to fear mongering.

Addendum (April 12, 2015): Based on comments that people have been making in various places on the internet, I think I should clarify the point that I am trying to make. I am not suggesting that the war has been won or even that we are definitely winning the war at the moment. Rather, I am saying that we have a chance to make this the turning point. Right now, there is widespread interest in Vani Hari, which means that it is more important to point out here errors now than it ever has been before. As I said, we are never going to get all of Hari’s current followers to abandon ship, but I think that we have a reasonable chance of stopping a lot of people from joining her cause. We will never make her go away, but we can stop her influence from spreading beyond her current following.

Posted in Uncategorized | Tagged , , , | 4 Comments

Evolution doesn’t give organisms what they need

beaver natural selection doesn't give organisms what they need evolution

Natural selection can only act on the genetic materials that are available to it, and this rarely results in the trait that is actually needed. Image via Berkley.edu

When I am teaching evolution, I often like to ask my students to think about why a particular feature or trait evolved. I might, for example, ask them why flying squirrels evolved a flap of skin between their legs that allows them to glide between trees, and when I ask questions like this, I frequently get responses along the lines of, “they needed that trait.” This is a very common misconception about evolution. Although most people realize that there isn’t a conscious entity controlling evolution, they nevertheless think that natural selection provides organisms with the traits that they need. This misconception can even lead to fallacious arguments such as, “if evolution is true, why hasn’t a perfect organism evolved?” The reality is that natural selection is constrained by the genetic variation that is currently in a population. Thus, it can only select among the available traits, rather than giving an organism what it truly needs. Therefore, we do not expect evolution to ever produce a perfect organism.

Note: in this post I am using the term “evolution” to refer specifically to evolution via natural selection.

There are several important points for understanding why evolution doesn’t given an organism what it needs. First, we have to realize that evolution is blind. I explained this in detail in a previous post, but to put it simply, evolution has no foresight or goal that it is working towards. It cannot predict the traits that will be useful to an organism in the future. Thus, even if evolution could give an organism what it needs right now that would not necessarily be what it needs several generations from now.

The second important point is simply that natural selection is limited to the variation that it has available to it. Let’s think about the flying squirrel example for a second. We can think of lots of traits that would be very useful to that animal. For example, it would surely be useful for the squirrels to be able to propel themselves at rocket speeds with explosive flatulence, but natural selection cannot make that happen unless the genes for explosive flatulence are available in the population. More realistically (although less amusingly), small, sharp quills in their fur would be very useful for warding off predators. Similarly, a musk gland like a skunk’s would have great benefit, but squirrels don’t have that weaponry because they don’t have the genes for it. Natural selection can’t make a trait out of nothing. It has to work with the genetic building materials that are available to it, and this means that we will probably never see a gas powered squirrel rocketing through the trees (too bad, that would be neat).

Fortunately, there is a mechanism for making new genetic information. I am of course referring to mutations. Natural selection actually removes variation from a population. So if natural selection was allowed to run its course without any interference, you would eventually get a population of clones. Thus, mutations are very important because they add new genes to a population. In other words, they give natural selection new material to work with. So, although squirrels do not currently have the genes for quills or a powerful skunk-like musk gland, they could someday have those features if the right mutation comes along. The catch is that mutations are totally random. Most of them are neutral (no harm or benefit), a few are harmful, and a few are beneficial, but exactly which ones you get is completely random. So, it doesn’t matter how badly you need a new trait. Whether or not you get the particular mutation that you need is pure dumb luck, and the fact that you need a trait has no effect on the likelihood that a mutation will provide that trait for you.

Finally, it’s important to realize that evolution is often a trade-off between traits. It operates on simple cost/benefit ratios, and anytime that the benefit of a trait outweighs the cost, natural selection will favor that trait. Human backs are a phenomenal example of this. The human back is an absolutely horrible design for supporting upright weight. It’s just terrible. That’s part of why so many people develop back problems. So why do we have such horrendous backs? Well, we evolved from quadrupeds, and the basic structure of our back isn’t half bad for walking on all fours. We evolved to be bipedal, however, because being bipedal has lots of advantages. Most notably, having hands rocks! By walking upright, our ancestors could use their hands while they were moving. They could pick fruit on the go, carry large prey back to camp, use weapons, collect building materials for making shelter, etc. All of these abilities were extremely beneficial to our ancestors. Therefore, the benefits of being bipedal outweighed the costs of having a bad back. Also, notice that evolution couldn’t give us the back that we needed because it was constrained to the building materials available to it. All it could do was modify a back that had evolved for being a quadruped. It couldn’t make an entirely new back from scratch.

Now, some people may still wonder why evolution hasn’t made a better back than what we currently have, and there are several answers to that. First, we again have to consider the limitations of evolution. Natural selection can only improve our backs if it has the genetic material necessary to do so. So we are at the whim of random mutations. Also, selection pressure has a big role here. Natural selection only favors a trait when it affects reproductive ability, but back problems often arise after the key child bearing years. This would give it a fairly low selection pressure because nature doesn’t care how long you live once you’ve had all of your children. In other words, longevity is selected for only if it increases the number of genes that you get into the next generation. Finally, we have only relatively recently expanded the average human life expectancy beyond around 35, and many back problems don’t arise until later than that. So if most people die before back problems develop, then there is nothing for nature to select. Also, because humans are social, even in a pre-industrialized society many people with back problems would still be able to live and have children. So, again, there wouldn’t be much for nature to act on.

In summary, evolution doesn’t grant species what they need. It has no foresight, it can only act on the genetic material that is available to it, and it relies entirely on random mutations to provide new building materials. This results in modifications to existing traits, which often involves some form of a trade-off, and rarely produces the trait that is truly needed.

Posted in Science of Evolution | Tagged , , | Comments Off on Evolution doesn’t give organisms what they need

Basic Statistics Part 3: The Dangers of Large Data Sets: A Tale of P values, Error Rates, and Bonferroni Corrections

In previous posts, I have explained the importance of having lots of data, but what I failed to mention was the dangers of analyzing these large data sets. You see, all real data has variation in it, and when you have a very large data set, you can usually subset it enough that eventually you find a subset that, just by chance, fits your preconceived view. Sometimes, these erroneous results arise as a deliberate form of academic dishonesty, but other times they come from honest mistakes. Regardless of their origin, they present a very serious problem because to the untrained eye (and sometimes even to the trained eye), they seem to show scientific evidence for truly absurd positions, and an enormous number of the studies and “facts” that anti-scientists cite are actually the result of this illegitimate sub-setting of large data sets. Therefore, I want to explain how and why these erroneous results arise, how scientists deal with them, and how you can watch for them so that you are not duped by research which appears to carry all the hallmarks of good science.

Note: I have split this post up into two sections. The first just explains the phenomena without going into the actual math or the gritty details of what is going on. The second half, called “Technical Notes” explains the math behind this problem. I encourage everyone to read both sections, but you can get the basic idea just by reading the first section.

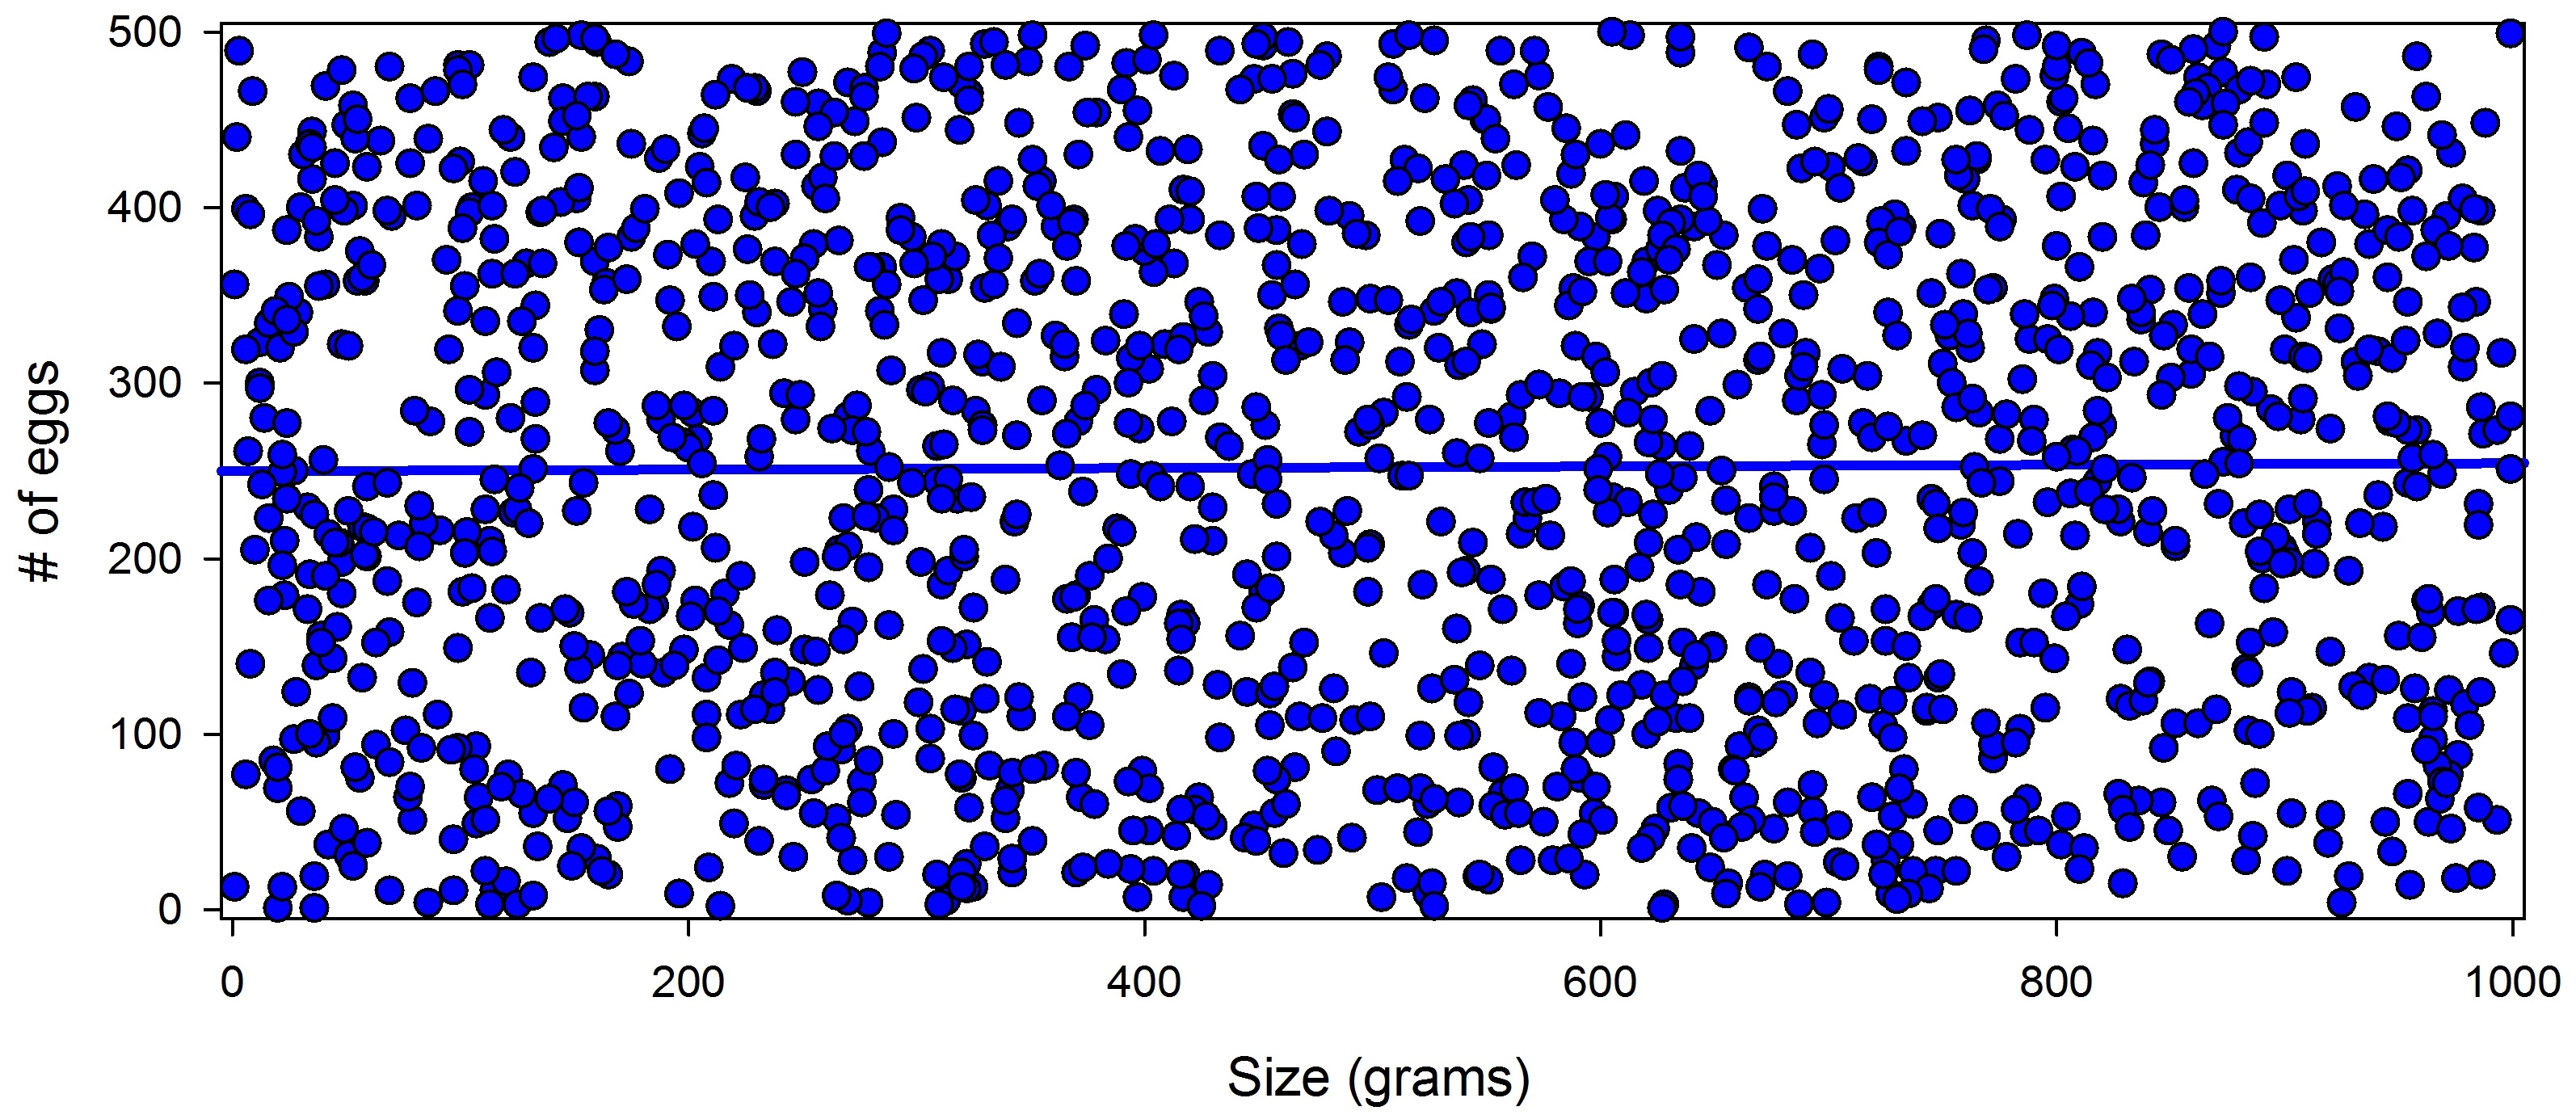
I want to illustrate how this works using a totally fictitious data set. To set up this example, let’s suppose that I was working on a particular species of frog, and I wanted to know how body size effected clutch size (i.e., the number of eggs that a female lays). I examined this by measuring female frogs and their clutch sizes at 30 populations (assume that I used proper controls so that any correlation would actually show causation). Now, remember that this is a fictional data set, so to actually generate it, I used the statistical program R to generate 30 sets of random data. Each set contained the body size and clutch size for 50 individuals. For body size, the computer randomly selected a number between 1 and 1,000 (inclusive), and for clutch size it selected a random number between 1 and 500 (inclusive). So I got “measurements” from a total of 1,500 “individuals.” When I put all of those individuals together, I got the figure below.

Figure 1: A comparison of body size and clutch size for my fictional data set (data were randomly selected). As expected, there is no relationship between our variables. You can see this in the flat trend line.

Figure 1: A comparison of body size and clutch size for my fictional data set (data were randomly selected). As expected, there is no relationship between our variables. You can see this in the flat trend line.

As we would expect, there is no relationship between body size and the number of eggs that a female laid. This is what we should find since the data came from a random number generator. In this case, it is pretty obvious to just look at the trend line and see that there are no relationships, but scientists like to actually test things statistically because statistics give us an objective way to tell determine whether or not there are any relationships. For these data, the appropriate test is what is known as a Spearman rank test. Running this test produces a P value of 0.7615. I explain P values more in the Technical Notes section, but for now, just realize that for most scientific studies, anything less than 0.05 is considered significant. So when you see a scientific study state that it found a “significant difference” or “significant relationship” it usually means that the P value was less than 0.05.

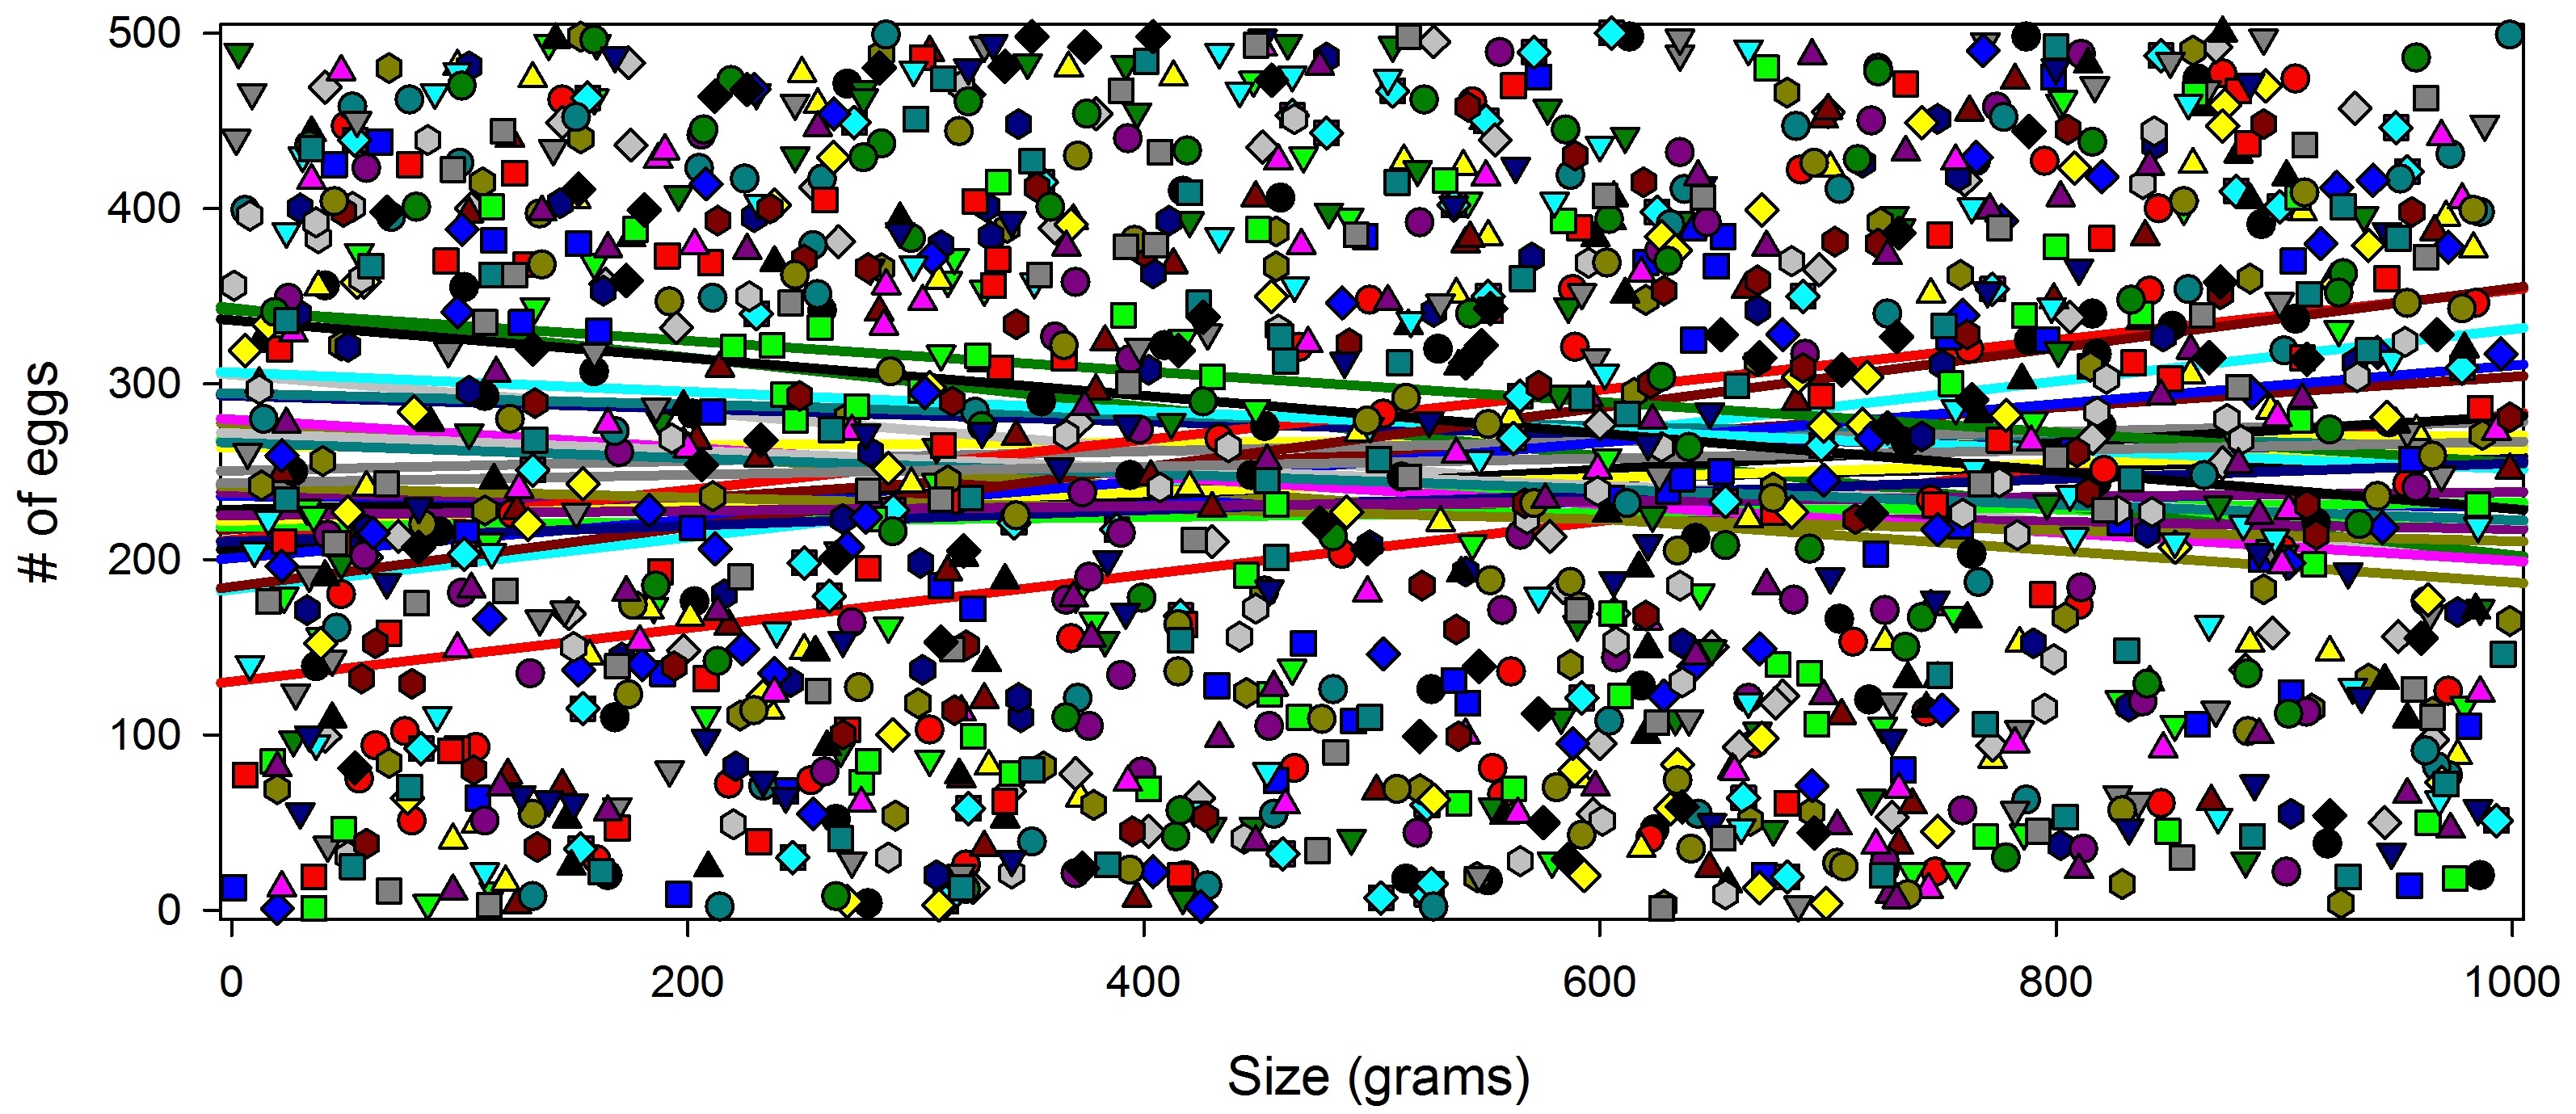
So far, everything is as it should be: there is no significant relationship. However, watch what happens when I subset the data. This time, I’m going to display each population separately.

Figure 2: These are the same data as figure 1, but the data have been subset by population so that each population is now shown separately (note: the data are fictional and were randomly generated).

Figure 2: These are the same data as figure 1, but the data have been subset by population so that each population is now shown separately (note: the data are fictional and were randomly generated).

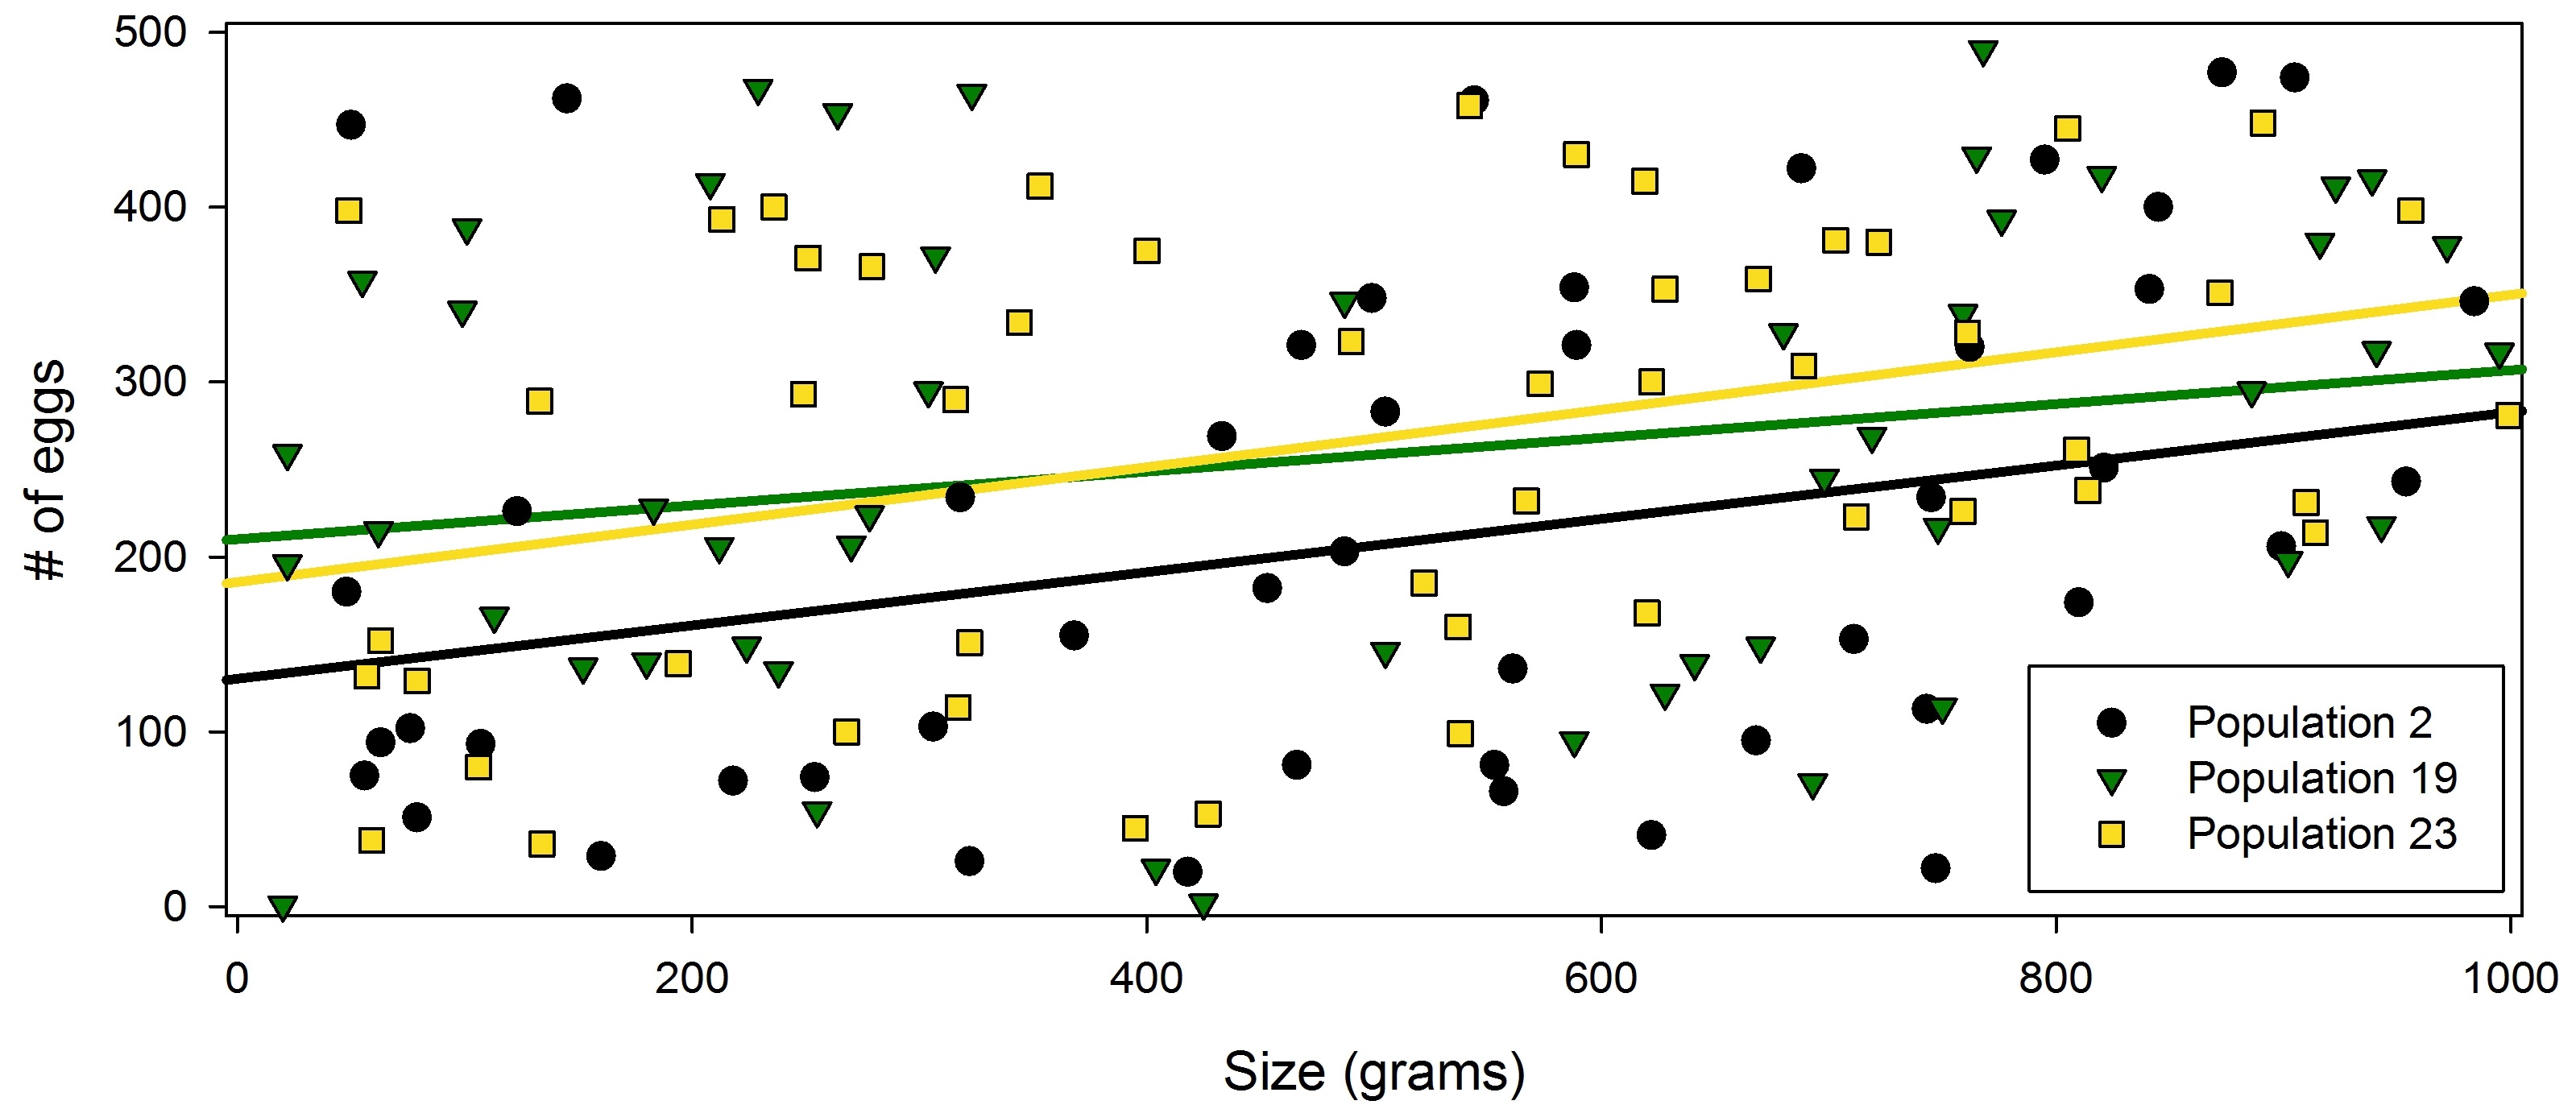
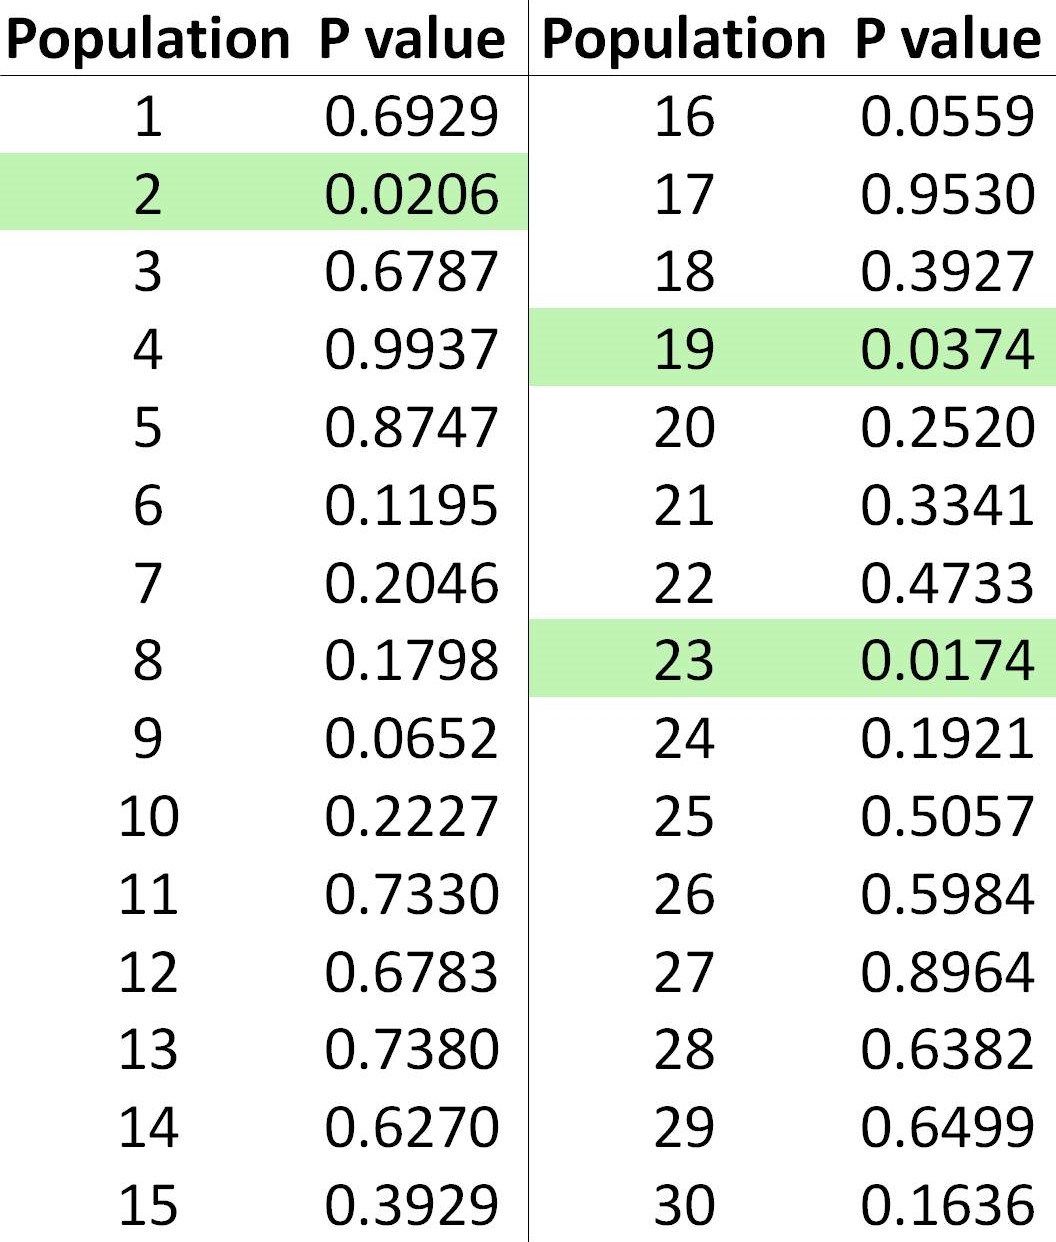
That’s obviously a bit of a mess to look at, but a few of those lines appear to be showing a relationship, and when we run a Spearman rank test on each subset, we find that populations 2, 19, and 23 all had a significant positive relationship between frog size and clutch size!

 Figure 3: This just shows the data for populations 2, 19, and 23. All three of them had significant positive relationships. (note: the data are fictional and were randomly generated)

Figure 3: This just shows the data for populations 2, 19, and 23. All three of them had significant positive relationships. (note: the data are fictional and were randomly generated)

illustration of a type one error 1

Table 1: P values for all 30 fictional populations. Anything less than 0.05 was considered statistically significant. The three significant populations have been highlighted.

Unless you already have a good understanding of probability theory, this should surprise, shock, and disturb you. We know that there is not actually a relationship between these two variables because I randomly selected the numbers, yet three of our populations are showing significant relationships! What is going on here? Are all statistics part of a massive lie by the government/big pharma/Monsanto designed to deceive us into allowing them to poison the food supply, fill our children with toxins, neuter our pets, and inject us with mind controlling chemicals!? Hardly.

The reality is that this is a well-known statistical fluke known as a type 1 error. This type of error occurs anytime that you incorrectly conclude that there is either a relationship between variables or a difference between groups (see Technical Notes for details). This is simply an unavoidable byproduct of the law of large numbers. Because of natural variation in data, you will inevitably get erroneous results from time to time. Fortunately, there are ways to control this type of error when you are working with subgroups of large data sets (see Technical Notes). The problem is that sometimes studies that did not use these controls manage to make it through the peer-review process, and the media and general public have a panic over “results” that are actually just statistical outliers.
The breeding habits of frogs rarely make the news, so to illustrate this problem, imagine instead that my data set was looking at the side effects of a vaccine, or, perhaps it was looking for relationships between GMO consumption and neurological problems among different age groups. You can no doubt envision the headlines, “GMOs are dangerous for 10-15 year olds,” “New study proves that GMOs are dangerous,” etc. The problem is that, in this example, we know that the results are spurious. They are just from random chance, but to the untrained eye, they appear to show significant relationships for certain subgroups.

My data set is fictional, but this happens with real data and it causes all manner of problems. A great example of this occurred last year in a highly publicized paper called, “Measles-mumps-rubella vaccination timing and autism among young African American boys: a reanalysis of CDC data.” The headlines from the media and anti-vaccers were predictable, “New Study Finds A 340 Percent Increased Risk Of Autism In Boys Who Receive MMR Vaccine On Time” (from Collective-evolution), “MMR vaccines cause 340% increased risk of autism in African American infants” (from Natural News), etc. When we look at the actual study though, we find that it is fraught with problems. The one that I want to focus on is sub-setting. The authors took a data set of several hundred children, then subset it by race, then subset those subsets by sex, then subset those subsets by age at injection. So we now have lots of subsets, and out of all of those subsets only the group of 36 month old African American males was significant, and the authors failed to control their type 1 error rate. Is the problem with this approach obvious? It should be. This is exactly the same thing that happened with my fictional frog data. Once you subset the data enough, you will eventually find some tiny subset that just by chance appears to support your position.

Further, even if this result wasn’t simply a statistical anomaly, the “news” articles about it are still a clear example of a sharpshooter fallacy, because 36 month old African American boys was the only group that showed a significant relationship. The headlines should have said, “MMR vaccine safe for everyone except 36 month old African American males.” Males of all other races = no relationship. African American males of other age groups = no relationship. African American girls of any age group = no relationship, etc. This one, tiny subgroup is the only group with a significant difference, making this is a classic type 1 error. Fortunately, I was not the only one who could spot the problem with this paper, and multiple scientists quickly pointed out its numerous flaws, ultimately resulting in a speedy retraction by the journal.

Now that you understand how this works, you should be able to spot this problem in lots of pseudoscientific papers. For example, many of the papers that I have read on homeopathy used lots of different measurements for the exact same treatment without controlling the type 1 error rate, and out of the 20 types of measurements that they used, one happened to show a significant improvement. When you get results like that, you shouldn’t conclude that homeopathy works. Rather, you must acknowledge that 19 out of 20 measurements showed no improvement, therefore, the one that did show an improvement was probably a statistical outlier.

Before delving into some fun mathematical details, I want to discuss one last case where this occurs. Everything that I have talked about so far has been either a deliberate manipulation of the data, or a mistake by the researchers in which they did not use the correct statistical methods. There is, however, another way that you get these spurious results without any mistakes or deception by the researchers. Let’s go back to my frog populations again, but this time, imagine that instead of studying all 30 populations, I just studied population #2 (assume that I got the same data as I did in my simulation). There was no dishonest or biased reason that I chose that population. It was just the one that was available for me to examine. Studying that population would, however, give me an erroneous, significant result, but because that was the only population that I studied, I would have no way of knowing that the result was incorrect. Even if I did everything correctly, designed a perfect project, and used the appropriate statistics, I would still get and publish a false result without ever knowing that I was doing so.

It’s important to understand this because this problem happens in real research. Papers get published by good, honest researchers saying that a drug works or a treatment is dangerous when, in fact, the results were simply from statistical anomalies. This is one of the key reasons that scientists try to replicate each others research. Suppose, for example, that 29 other researchers decided to try to replicate my results by studying the other 29 frog populations. Now, we would have 30 papers, 3 of which say that body size affects clutch size and 27 that say that there is no relationship. This lets us do something called a meta-analysis. This is an extremely powerful tool where you take the data from several studies and run your analyses across the whole data set. You can think of this like taking all the individual populations of frogs (Figure 2) and combining them into one massive population (Figure 1; the math is actually significantly more complicated than that, but that’s the basic idea). This method is great because it lets us see the central trends, rather than the statistical outliers. Also, remember that the law of large numbers tells us that the calculated value of large data sets should be very close to the true value. In other words, large data sets should give us very accurate results.

One of my favorite meta-analyses was published last year, and looked at the relationship between the MMR vaccine and neurological problems like autism. I cite this study a lot on this blog, but that is because it provides such powerful evidence that vaccines are safe. It combined the results of 10 different safety trials, giving it an enormous sample size of over 1.2 million children (feel free to rub that in the face of any anti-vaccer who says that the safety of vaccines hasn’t been tested). With that large of a sample size we expect to see true results, not statistical outliers. So the fact that it found no relationships between vaccines and autism is extremely powerful evidence that vaccines do not cause autism.

You can find these meta-analyses for lots of different topics, and they are crucially important because they have such large sample sizes. You can, for example, find scattered papers from individual trails that found significant improvements using homeopathy, but you can also find plenty of papers showing that homeopathy did not work for many trials, and it can be difficult (especially as a layperson) to wade through that flood of information and determine what is actually going on and which studies you should trust. That’s the beauty of meta-analyses, they comb through the literature for you and give you the central trends of the data. To be clear, I am not advocating that you blindly accept the results of meta-analyses. You still need to carefully and rationally examine them, just like you do every other paper, but, they often do a much better job of presenting true results.

In conclusion, I would like to give several pieces of advice to those of you who are interested in truly informing yourself about scientific topics (as I hope you all are). First, take the time to learn at least the basics of statistics. Learn how the tests work, when to use them, and how to interpret their results. I personally recommend studying the Handbook of Biological Statistics. It’s a great website that does a fantastic job of introducing a lot of statistical tests in a way that most people can understand. Second, watch out for these type 1 errors. Learn the methods that we use to control them, and when you’re reading the literature, make sure that the authors used those controls. Finally, look for the meta-analyses. They are one of our most powerful tools, and they can really help you sort through the tangled mess that is academic literature.

Technical Notes
P-values and alphas
In statistics, you are generally testing two hypotheses: the null hypothesis and the alternative hypothesis. The null hypothesis usually states either that there is no association between the variables you are testing or that there are no differences between your groups. The alternative hypothesis states the opposite. It states that there is a significant relationship/difference. The P value is the probability of getting the results that you got if the null hypothesis is actually true. So if you are comparing the average value of two groups (group 1 mean = 120, group 2 mean = 130), and you get a P value of 0.8, that means that if there is no significant difference between those groups (i.e., the null hypothesis is true) then, just by chance, you should get the result that you got 80% of the time. So most likely, your “difference” of an average of 10 is just a result of chance variation in the data. In contrast, if you get a P value of 0.0001, that means that if the null hypothesis is actually true, you should only get your results 0.01% of the time. This makes it very likely that your difference is a true difference, rather than just a statistical anomaly. Thus, the smaller your P value, the more confidence you have in your results.

It’s important to note that you can never prove anything with statistics. You can show that there is only a 0.0000000000000000000000000000000000000000000000000001% chance of getting your result if the null is true, but you can never prove anything with 100% certainty.

To objectively determine whether or not there is a significant relationship/difference, you compare your P value to a predetermined significance value called alpha. Generally speaking, you use an alpha of 0.05, but sometimes other alphas are used, especially 0.01. So, if your calculated P value is less than your alpha, you reject the null hypothesis. In other words, you conclude that your result is statistically significant. Whereas if your P value is equal to or greater than your alpha, you fail to reject the null hypothesis (this is not the same thing as accepting the null, but that’s a conversation for another post). Importantly, your alpha must be determined ahead of time, and you are not allowed to cheat. If your alpha is 0.05 and your P value is 0.051, you cannot claim significance or talk about your results as if they were significant. This is, however, another case where meta-analyses come in handy. Sometimes, there is a significant result, but your sample size was too small to detect it, so by combing your data with the data from other studies, you can boost the sample size and reveal a trend that was not visible just by looking at your data.

Type 1 and type 2 errors
A type 1 error occurs anytime that you reject the null hypothesis when the null hypothesis was actually correct. Remember, P values are the probability of getting your results if the null hypothesis is actually true. So, if you have an alpha of 0.05, then a P value of 0.049 will be significant, but you should get that result just by chance 4.9% of the time. If you think back to my fictional frog data, this is why some of the populations were significant. Because I had 30 populations, I expected that just by chance some of them would happen to have body sizes that produced a P value less than 0.05.

Now, you may be thinking, “well why not just make the alpha really tiny, that way you almost never have a type 1 error.” The problem is that then you get a type 2 error. This occurs when you fail to reject the null hypothesis, but the null hypothesis was actually incorrect. In other words, there was a significant relationship, but you didn’t detect it. So if, for example, we used an alpha of 0.00001, we would have an extremely low type 1 error rate, but we would almost never have any significant results. In other words, almost all of our studies would be type 2 errors. So the alpha level is a balance between type 1 and type 2 errors. If it’s too large, then you have too many type 1 errors, but if it is too small, then you have too many type 2 errors.

Family-wise type 1 error rates
The family-wise type one error rate is basically what this whole post has been about. When you are testing the same thing multiple times, your actual type 1 error rate is not the standard alpha. Think about it this way, if you did 100 identical experiments and the null hypothesis was true, we would expect, just by chance, that five of the experiments would have a P value of 0.05. This is, again, what happened with the frog data. So you need a new alpha level that accounts for the fact that you are doing multiple tests on the same question. This new alpha is your family wise type 1 error rate.

There are several ways to calculate the modified error rates, but one of the most popular is the Bonferroni correction. To do this, you take the alpha that you actually want (usually 0.05) and divide it by the number of tests you are doing. This results in a 5% chance that any of your results will have a P value of 0.05 if the null hypothesis is correct. So, if we apply this to my fictional frog data, I had 30 populations, so my corrected alpha is 0.05/30 = 0.00167. So, for any of my populations to show a significant relationship, they must have a P value less than 0.00167. My lowest P value was, however, 0.0174. So, now that done the correct analysis and have properly controlled the family-wise error rate, we can see that there are no significant relationships between body size and clutch size, which is, of course, what we should see since these data were randomly generated. This is why it is so important to understand these statistics: if you don’t control your family-wise error rate, you are going to get erroneous results.

It’s worth mentioning that the standard Bonferroni correction tends to slightly inflate the type 2 error rate, so I (and many other researchers) prefer the sequential Bonferroni correction. This works the same basic way but with one important difference: rather than comparing all of your P values to alpha/# of tests, you compare the lowest P value to alpha/# of tests, the second lowest P value to alpha/(# of tests – 1), the third lowest P value to alpha/(# of tests – 2), etc. You keep doing this until you reach a P value is that is greater than or equal to the alpha you are comparing it to. At that point, you conclude that that test and all subsequent tests are not significant. So, for my frog data, we are done after the first comparison because even my lowest P value was greater than 0.00167, but let’s suppose instead that my four lowest P values were: 0.0001, 0.0002, 0.0016, and 0.003. First, we compare 0.0001 to 0.05/30 = 0.00167. Since 0.0001 is less than 0.00167, we reject the null. Next, we compare 0.0002 to 0.05/29 = 0.00172. Again, reject the null. Next, we compare 0.0016 to 0.05/28 = 0.00179. Again, reject the null. Then, we compare 0.003 to 0.05/27 = 0.00185. Now, our P value is greater than our alpha, so we fail to reject the null for this test and for all 26 other tests that produced larger P values.

A final way to deal with this problem of multiple comparisons (and really the best way) is to design your experiment such that you can use a statistical test that incorporates your subsets into the model and accounts for the fact that you are making several comparisons. Entire books have been written on this topic, so I won’t go into details, but to put it simply, some tests (like the ever popular ANOVA) allow you to enter different groups as factors in your analysis. Thus, the test makes the comparisons while controlling the error rate for you. Again, I want to impress upon you that if you want to be able to understand scientific results, you need to at least learn the most common statistical tests and how and when they are used. This is fundamental to understanding modern science. If you don’t understand statistics, you’re not going to be able to understand scientific papers, at least not in a way that lets you objectively assess the authors’ conclusions.

Other posts on statistics:


Posted in Nature of Science | Tagged , , , | 2 Comments

What does it mean to be a skeptic?

It is good to be skeptical about everything that you hear and read. In fact, skepticism is one of the defining characteristics of a scientist. Nevertheless, terms like “skeptic” and “open-minded” are often misappropriated by people in the anti-science movement, and many of the most biased people on the planet are under the delusion that they are skeptical. Climate change deniers, for example, often refer to themselves as, “climate change skeptics,” and it is rare to have a conversation with anti-vaccers without them referring to pro-vaccers as “sheeple.” Therefore, I want to briefly examine what it actually means to be a skeptic.

First, I want to clear up a common misconception. Many people seem to be under the impression that being a skeptic means going against the mainstream view. Thus, anti-vaccers consider themselves to be “thinking parents,” while viewing everyone else as “sheeple.” There is, however, nothing in the definition of “skeptic” that requires you to reject a scientific consensus. You are welcome to accept a consensus as long as that consensus formed as a result of strong, scientific evidence.

Having cleared up that misconception, let’s move on to the definition of a skeptic. There are basically two parts to being a skeptic. First, a true skeptic does not accept something or commit to a position unless there is sufficient evidence for that position. In other words, a skeptic questions what he/she is told and doesn’t accept anything until they have carefully studied the issue and examined the available evidence. Importantly, you must use good sources when fact checking. So, for example, reading Natural News does not constitute examining the evidence. Rather, you need to look at the original, peer-reviewed research.

This first requirement of skepticism may sound simple, but it is something that most people struggle with (including people who strongly support science). It is very easy and tempting to quickly latch onto some new study that seems to support your position, but it is crucially important that you avoid this trap. You must always carefully examine the evidence regardless of whether or not it supports your position. This is, in fact, one of the most important things that students of science get taught in graduate school. The peer-review system works well, but it is far from perfect, and sometimes bad research does get published. Therefore, you can never assume that something is true, and you must rigorously and carefully examine everything before accepting or rejecting it.

The second prerequisite for skepticism is being open-minded. This simply means that you are willing to change your position if you are shown evidence to the contrary. The term, “open-minded” has, however, been stolen and perverted by the anti-science movement. On numerous occasions, I have had people tell me that I need “open my mind about alternative medicines.” The reality is that am completely open to the possibility that alternative medicines work, but I’m not going to accept that they work until they have passed rigorous scientific testing. That’s not being close-minded, that’s being skeptical. Similarly, I have had multiple anti-vaccers tell me that my training in the sciences has made me, “close-minded.” When I pressed these people for what they meant , they explained that I was being close-minded by demanding scientific studies and refusing to accept anecdotal evidence. Think about this for a second. According to them, those of us who argue in favor of science are close-minded because we demand scientific evidence for a debate about science. Further, these same people will usually proudly proclaim that nothing will ever change their minds, which is, of course, the very definition of close-minded.

Accepting something without sufficient evidence is not being open-minded, it’s being gullible. It is not, for example, open-minded to use anecdotal evidence to arrive at the conclusion that vaccines cause autism. Rather, someone who is open-minded would reject those anecdotal reports in favor of the large, carefully controlled studies which clearly show that vaccines do not cause autism. It is important to note, however, that nothing in science is ever 100% certain. Thus, being truly open-minded means that you are always willing to consider the possibility that you might be wrong no matter how clear the data currently seem. So, for example, if in the future a large, well designed, carefully controlled study is published showing that vaccines do cause autism, and the results of that study are replicated by other researchers, I promise you that skeptics around the world (myself included) will write and prominently display posts admitting that we were wrong about the relationship between vaccines and autism. That is what it truly means to be open-minded. It means that you are willing o change your view when presented with good evidence. It does not mean that you are willing to blindly accept something despite a lack of evidence.

In summary, a skeptic is simply someone who demands good evidence before accepting something and is willing to change their view when it conflicts with the evidence. These requirements are easy to say, but often hard to follow. Nevertheless, everyone should strive to be a skeptic. You should use good sources, question your assumptions, demand evidence, beware of cognitive biases, and above all else, never hold any position so dearly that you are not willing to challenge it.

Posted in Uncategorized | Tagged , | Comments Off on What does it mean to be a skeptic?

Evolution is blind

Note: the notion that evolution is blind has nothing to do with Darwin's eyesight. I just thought this was an amusing image.

The notion that evolution is blind has nothing to do with Darwin’s eyesight. I just thought this was an amusing image.

One of the central tenets of evolutionary biology is the concept that evolution is blind. In other words, it has not foresight or goal. This principle is extremely important for understanding how evolution works, but it’s a concept that is often misunderstood, even among people who accept evolution. Further, this lack of understanding often leads to a number of erroneous creationist arguments such as the claim that whales defy evolutionary theory. Similarly, the popular irreducible complexity argument is easily defeated once we understand that evolution is blind.

Note: in this post, I am going to use “evolution” to refer specifically to evolution by natural selection. Remember that evolution is simply a change in allele frequencies over time, and natural selection is one among several mechanisms that causes allele frequencies to change (others include things like gene flow and genetic drift). The concept of blind evolution is, however, most germane to evolution by natural selection; therefore, that is what I will be describing in this post.

Before I can explain what is meant by, “evolution is blind,” I have to give a brief primer on how evolution by natural selection works. Natural selection requires two things: heritable variation for a trait and selection for that trait. Both of these are nearly always met in real populations. In other words, in any population there is variation for a trait (e.g., not all individuals are the same height) and that variation is nearly always heritable (e.g., tall individuals tend to produce tall offspring). Further, that variation affects fitness (e.g., tall individuals may be able to get more food, which gives them more energy, which lets them produce more offspring), so certain traits get “selected” by virtue of the fact that the individuals with those traits produce more offspring than individuals without those traits. As a result, the genes for the beneficial trait will be more common in the next generation. Thus, the population will evolve because its allele frequencies will change.

There are several important clarifications to be made here. First, everyone accepts natural selection. It’s a simple mathematical certainty (even young earth creationist organizations accept it, they just place arbitrary and logically invalid limits on it). Second, evolution only acts on populations not individuals. Individuals simply cannot evolve. Third, in evolutionary terms, “fitness” refers to the number of genes that you get into the next generation, not physical strength. Generally speaking, being physically fit does give you a higher evolutionary fitness, but not always. Thus, the phrase, “survival of the fittest” is something of a misnomer. Survival is important only in that it gives you more time to produce offspring, and there are plenty of short lived species that have a high evolutionary fitness. For example, think about species like many octopuses where the females die after laying their first and only clutch of eggs. They have a lower survivorship, but a high fitness (fun fact: “octopi” = several within a species, “octopuses” = several species). Thus, natural selection only acts on traits that affect your reproductive potential. These may be traits that directly influence your survivorship, such as antipredatory behaviors, but they can also be traits like foraging ability (more food = more energy = more offspring) and the ability to attract a mate (i.e., sexual selection).

It may seem like I have digressed from my thesis, but this is all important groundwork for understanding blind evolution. They key here is that evolution has no foresight or direction. In other words, it has no goal or endpoint in mind. In each generation, it simply adapts populations to their current environment, but if that environment changes, then an adaptation that has been useful for thousands of generations can suddenly be detrimental. Let’s say, for example, that we have a group of birds who eat very small seeds that are held in little folds of the plants. Thus, they need fairly small, skinny beaks to get to the seeds. Therefore, in each generation, the birds with the beaks that are most well suited to reaching into the folds get the most food and produce the most offspring. So for many generations, evolution has been shaping the birds beaks to fit in these folds. However, one year there is a massive drought, and all of the plants that the birds usually get seeds from die, but another species with large thick seeds survives. Now, the small, petite beaks that have been so useful are suddenly detrimental, and large thick beaks are useful. This means that the birds who previously would have had a very high fitness are now going to have a very low fitness, and the thick billed birds that would previously have had a low fitness are suddenly going to have a high fitness. This is what we mean by, “evolution is blind.” It cannot anticipate the future needs of an organism. All it does is adapt a population to its present environment.

Hopefully, at this point, the problem with creationists’ whale argument is clear. For those who aren’t familiar with this argument, creationists often claim that whales are a problem for evolution because evolutionary history tells us that all land organisms evolved from a marine ancestor, but whales would have had to evolve from a terrestrial ancestor. Thus, creationists claim that whales had to evolve “backwards” or “de-evolve” because they went back to water. Similar arguments are made about species like flightless birds.

The problem with these arguments is simply that they ignore this concept of evolution being blind. There is no “forwards” or “backwards.” At one point in time, for a certain population of marine organisms, it was beneficial to be able to come out on land. Therefore traits that allowed individuals to come out on land were selected for. Then, millions of years later, for a certain population of land-dwelling mammals, it was beneficial to be able to go into the water. Therefore, nature selected the traits that allowed individuals to enter the water. This is in no way shape or form a problem for evolution because in both cases, populations were evolving to match their current environment.

It’s also worth noting that there is really no such thing as being “more evolved” because evolution has no direction. Chimps are not, for example, more evolved than a single celled bacteria living in a hot spring. Chimps are certainly more complex, and they certainly have accumulated more genetic changes, but they are not “more evolved” because that suggests that evolution is directional. Both chimps and bacteria are well adapted to their current environments, and that is all that evolution does: it adapts populations to their present environments. Think about it this way, a chimp would die in the hot springs where many bacteria thrive, and the specialized bacteria would die in the chimp’s rainforest. They are both highly adapted for their environments, but neither one is more evolved than the other. To put this another way, you can say that chimps are more evolved for a life in the forest, but you cannot make a broad comparison between them and bacteria because it is equally fair to say that certain bacteria are more evolved for a life in the hot springs.

It’s also important to realize that because evolution is blind, we don’t expect it to produce perfect organisms. Rather, we expect organisms to be a hodgepodge of former traits. In other words, we expect them to have a large number of evolutionary leftovers. We call these leftovers vestigial traits. I plan on devoting an entire post to them in the future because they provide extremely strong evidence for evolution, but to describe them briefly, these are traits that have no function or a very limited function in the current organism, but they would have been fully functional in that organism’s ancestors. Blind cave fish are the classic example of vestigial structures. These are fish that have eyes, but the eyes are no longer functional and often have a layer of skin growing over them because the fish spends its whole life inside a pitch black cave. So, at one point in time there was a population of fish living outside of a cave that had functional eyes. Then, for one reason or another, the fish ended up inside of the cave where the eyes were no longer useful. Thus, nature stopped selecting for vision, and the eyes slowly accumulated mutations to the point that they are now useless. Animals are full of examples of these structures. For example, baleen whales and certain snakes retain non-functional pelvic bones. Humans also have many vestigials. Our tail bones, goose bumps, wisdom teeth, and multiple other features are all vestiges of our evolutionary history. They are evolutionary leftovers that were beneficial in previous environments and situations but are no longer beneficial today.

Finally, I want to briefly discredit irreducible complexity. I addressed this topic in detail here, but to put it in its simplest terms, irreducible complexity states that certain biological systems are highly complex to the point that removing any one part prevents the system from function. For example, irreducible complexity claims that the bacterial flagellum couldn’t have evolved because it requires 42 proteins to function (for most species), and if any one protein is removed, it no longer functions as a flagellum. Thus, the argument is that it couldn’t have evolved because no one protein would be useful unless all of the other proteins were already in place. The problem is that this argument sets up the flagellum as some ultimate endpoint that evolution is working towards, but as you now know, that’s not the way that evolution works. Each protein doesn’t need to function as a flagellum, it just has to function. In other words, if the protein does anything useful, it will be selected for. You see, the function of a trait can change in response to new environments or as a result of new mutations. In fact, we know that all of the proteins in flagella are used for other things in the cell, and often several of them work together to perform a function. It is not hard to imagine a series of mutations that brings these functions together. In fact, we have a hypothetical pathway that would allow a flagellum to evolve step by step with each step being useful. Only the final step functions as a flagellum, but that doesn’t matter because each step still functions, and that is all that evolution needs because it is a completely blind process that acts without any forethought or anticipation of future needs.

Summary
Evolution by natural selection simply adapts populations to their current environments. It cannot anticipate future environments or needs. As a result, a trait may be selected for in one generation, and selected against in a later generation after the environment changes. Therefore, it is incorrect to describe evolution as having a “direction” because it is simply responding to the current conditions.

Related posts:

Posted in Science of Evolution | Tagged , , , , | Comments Off on Evolution is blind