
The US is experiencing another sharp increase in COVID19 cases. This is a simple fact, but as always seems to be the case in today’s world, this fact is being treated as an opinion. Countless people (including prominent politicians and even the president) are claiming that cases are not actually increasing, and the apparent increase is simply the result of increased testing. This claim is dangerous and untrue, but it also offers a good opportunity to teach some lessons in data analysis. Obviously, an increase in testing will result in an increase in the number of cases that are documented, that much is true, but that doesn’t necessarily mean that the entirety of the increase is from increased testing. So how can we tell whether the true number of cases is increasing? There are multiple ways to examine this, and I’m going to walk through several of them and try to explain the stats in a non-technical way so that everyone can really grasp these concepts.
To begin with, I’m not actually going to talk about coronavirus. That topic has, unfortunately, becomes such a political battleground (even though it should be entirely scientific) that it is difficult to get people to think clearly and unbiasdly about it. So instead, let’s start by talking about Willy Wonka’s chocolate factory. Like most chocolate factories, they sometimes get insects in their chocolate bars and they test subsets of them to see how often this occurs. This situation is analogous to testing for a disease, and the math is the same, so let’s use it as an example to understand the math, then we’ll apply that understanding to coronavirus.
For sake of example, let’s say that Wonka produces 10,000 chocolate bars a day, and examines 2,000 of them for the presence of insects (these are the tests). Further, as you might have guess, his chocolate factory has rather lax hygiene standards, so out of those 10,000 bars, 1,000 actually have insects. How many do we expect to have insects (i.e., be positive cases) in the sample of 2,000 tests? This is easy to calculate. 1,000 is 10% of 10,000, so we expect 10% of the tests to be positive. Thus, out of 2,000 tests, we expect to get 200 bars with insects (i.e., documented cases; note that I am acting as if testing is random to make the math easy for all to follow; this is a simplification, but doesn’t actually change the point; see note at the end).
Now, suppose that Wonka increases the testing and gets higher numbers of positives (more cases). What does that mean? It could simply mean that the number of bars with insects is unchanged, but more are found due to more testing. However, it is also possible that both testing and the true number of bars with insects are both increasing. How can we tell which is occurring?
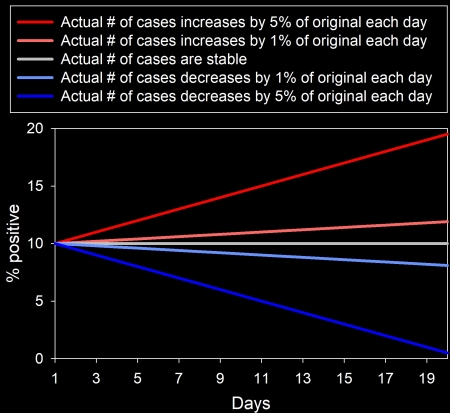
Figure 1: Changes in the percent of tests that are positive under different scenarios. For each line, testing increases by 10% of its starting value each day, but the number of actual cases (not observed cases) varies, and the lines show the percent of tests that were positive. Blue lines show a decrease in actual cases over time, the grey line shows no change in actual cases, and the red lines show an increase in actual cases. As you can see, anytime that the total number of cases increases, the percent of tests that are positive will increase, whereas if the total number of cases is unchanged or decreases, the percent of positives will either remain stable or decrease, even if testing increases.
The answer lies in the percentage of tests that are positive. If the actual number of bars with insects is unchanged, and the increase in positives is simply due to increased testing, then the percent of tests that are positive will remain constant even though the total number of positive tests goes up (Figure 1). Think about the math from earlier. 10% of bars have insects. So, we expect roughly 10% of tests to be positive, regardless of how many tests we do (though the percentage will be more accurate with a larger sample size). So, if we do 2,000 tests, we expect 200 bars with insects (10% positive). If we do 4,000 tests, we expect 400 bars with insects (10% positive). If we do 6,000 tests, we expect 600 bars with insects (10% positive), etc. The total number of bars with insects (cases) increase as testing increases, but the percentage of those tests that are positive remains the same. As another example, imagine that you have a bag with 500 blue marbles and 500 red marbles. You reach into the bag and grab a handful. You expect to get roughly 50% of each color regardless of how many you grab (though you expect the value to be closer to 50% [more accurate] as sample size increases). It’s the same with testing.
So, if the increase is entirely from testing, the percent of tests that are positive should be unchanged, but what happens if the number of insects in chocolate bars are actually decreasing, while testing is increasing? What happens then? Well, the total number of positive test results may either go up or down (depending on the sizes of the decrease in insects and increase in testing), but the percentage of tests that are positive will always go down (Figure 1). Going back to the example, we expect 10% of tests to be positive when 1000 out of 10,000 bars actually have insects and 2,000 tests are conducted. Now, suppose that the number of bars with insects is cut in half (500) and testing is tripled (6,000). Now, we expect only 5% of tests to be positive, but 5% of 6,000 is 300. So, while the total number of observed positive cases increased, the percent of tests that were positive decreased. This tells us that the actual number of bars with insects is decreasing, despite the increase in testing.
Conversely, if more bars actually have insects, we expect a higher percentage of tests to be positive, even if the level of testing increases. Imagine, for example, that the number of bars with insects increases to 2,000 out of 10,000, while the number of tests also doubles (4,000). Now, we expect 20% of tests to be positive, resulting in 800 cases. See how that works?
I have illustrated all of these patterns in Figure 1, showing the hypothetical situation I have been describing with changes in testing and, sometimes, changes in the actual number of bars with insects over a 20-day period. Each line shows the percent of tests that were positive. The grey line shows the situation where testing increases but the actual number of bars with insects (cases) do not, the blue lines show increased testing with a decrease in the actual number of cases, and red lines show increased testing coupled with an increase in the actual number of cases. As you can hopefully see, the only way to get a decreasing percentage of positive tests is if the actual number of cases (not simply the number of documented cases) decreases, and any time that the actual number of cases increases, the percent of tests that are positive will also increase. This percentage of positive tests is key for understanding what is actually happening.

Figure 2: Percent of coronavirus tests that were positive for June. The first panel shows the data for the whole country, and the second shows two states with large outbreaks (Florida and Arizona). They are presented in separate panels simply so that the change for the whole country is not obscured by the much larger change for individual states. Data were downloaded from the Covid Tracking Project late on 28-June-20.
Now, with all of that in mind, let’s look at coronavirus in the US. If the situation is truly improving and the actual number of cases is truly decreasing and the apparent recent increase in cases is just a result of increased testing, as many argue, then we should see that the percent of tests that are positive has continued to decrease. That is not, however, what we see. It was decreasing for a while, but if we look at June (when things have been opening back up and when the spike in cases occurred) we see a statistically significant (P < 0.0001) increase in the percentage of tests that are positive (Figure 2). In other words, the increase in tests simply cannot explain the entirety of the increase in cases. It probably is a contributing factor, but the actual the actual number of coronavirus cases in the US is actually going up rapidly. That is a fact. To be clear, exactly what is happening varies by states, and some cases are experiencing decreases in the rates of positive tests, but many others are experiencing sharp increases, particularly in states like Florida and Arizona (Figure 2). They are very much experiencing viral outbreaks (Johns Hopkins has some very nice data and graphs for state data that I recommend looking at)..
There is another really useful way to examine this, which is to look at the percent change for number of tests and number of observed cases (positive tests). Sticking with chocolate bar example and using the data presented in Figure 1, we find that when testing increased by 100 tests each day, but the actual number of cases remained constant, the number of tests increased by 145% over time and the number of positive tests per day (cases) increased by 145%. This is what we expect if the actual number of bars with insects is constant, but the testing increases: the percent difference should be the same for both the total number of cases and the number of observed cases (positive tests). When testing increased by 100 tests a day and the actual number of bars with insects increased by 1% of the original level each day, however, the percent difference in tests was still 145%, but the number of positive tests (cases) increased by 216%, and when actual cases increased by 5% of the original level each day, the number of positive tests increased by 500%! Do you see how that works? If the increase is entirely from increased testing (while the actual number of cases remains the same), then both the increase in tests and the increase in observed cases will match. In contrast, if actual cases are also increasing, then the increase in positive tests will outpace the increase in testing.
So, what do we find for coronavirus in the US? Well, if we compare the last 7 days of May (7-day average) to the past 7 days of June (with the 28th being the most recent date based on when I downloaded the data), we find that the number of tests increase by 40.5%, while observed cases increased by 83.0%! In other words, the increase in cases substantially outpaces the increase in testing, clearly indicating that we are actually experiencing a real increase in coronavirus cases, not simply an increase in known cases due to increased testing. The situation is even more dire when you start looking at states where the largest outbreaks are occurring. In Arizona, for example, again comparing the last 7 days of May to the past 7 days of June, we find testing increased by 116.9%, but daily new cases increased by 498.2%. Florida is a similar story. Testing has increased by 88.3%, but daily new cases has increased by an astounding 726.7%! This is undeniably an outbreak.
Indeed, you can get a sense for these general trends just by looking at a comparison of testing rates and numbers of new cases over time (Figure 3). As you can see, at first, testing lagged well behind cases as we experience the first initial outbreak. Then, cases started declining, even though the number of tests continued a steady increase. It is only in the past few weeks (i.e., since social distancing restrictions, closures, etc. have been being lifted) that we see a spike in cases. Further, the recent spike in cases does not correspond to a spike in testing. Testing has been increasing at a steady rate, whereas cases suddenly shifted from a steady decrease to an exponential increase. In other words, the number of observed cases does not track well with the number of tests. If the current increase in cases was really a result of increased testing, then new cases should have been tracking with testing all along. They should have continued to increase after March, because testing increased. That’s not at all what we see, however. Again, testing simply can’t explain the trends. That doesn’t mean that there is no impact of testing, obviously there is, but it is clearly not the key thing driving trends.
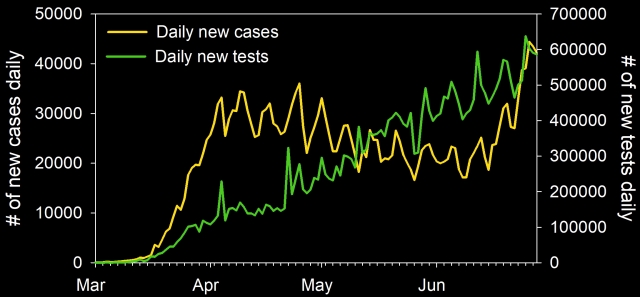
Figure 3: Coronavirus testing and cases for the USA. As you can see, cases are a poor match for testing, indicating that testing alone does not explain the recent increase in cases. The x-axis labels show the start of each month. Data were downloaded from the Covid Tracking Project late on 28-June-20.
Yet more evidence comes from hospitalization rates. The “its just more testing” argument relies on the notion of many asymptomatic people (or at least people with very mild cases) that have only been detected recently due to increased testing. If that was the case, then hospitalization rates should be remaining level or going down (if the virus is truly going away), yet many states are experiencing increased hospitalization rates, with the Texas Medical Center (an enormous complex) hitting 100% capacity for its ICU. That simply cannot be explained as a result of increased testing.
Fortunately, deaths have not started spiking yet. There are several reasons for this. One is that, this time, more young people are getting the disease. Another is simply that death rates inevitably lag behind infection rates, and it is very likely that deaths rates will increase in the coming weeks (though many experts are hopeful that we will be able to avoid the type of enormous spike we saw a few months ago).
In short, an actual examination of the data clearly and unequivocally shows that the current increase in coronavirus cases in the US cannot be explained simply as a result of increased testing. The percent of tests that are positive is increasing, which is a clear indication that the actual number of cases is increasing. Further, in states like Arizona and Florida, the numbers are truly shocking, with the increases in new cases massively outpacing the increases in testing. We are clearly still in the middle of a deadly outbreak, and it is getting worse. This isn’t a liberal conspiracy to undermine Donald Trump; it is a fact, and facts don’t change based on your political party.
Note: Please refrain from political comments. This post is about science and evidence and comments should likewise be about science and evidence (see Comment Rules).
Note: someone might object that my examples assume random testing, while testing is actually somewhat targeted, and people who are symptomatic or are known to have been in contact with someone who is infected are more likely to be tested. This fact is true, but actually doesn’t substantially change anything I’ve said. It does affect the exact percentages but doesn’t change my point about the trends. It is still true that the only way to get an increasing percentage of positive tests while the testing rate is increasing is for the actual number of total cases to be increasing (technically, this could also happen if we learned to do a much better job at targeting our tests, but there is no indication of this that I have seen; certainly not enough to cause the numbers we are seeing, and it still would not explain the increases in hospitalization rates).
Data source: The data I presented here were downloaded from the Covid Tracking Project late on 28-June-20.

Please refrain from political comments. This post is about science and evidence and comments should likewise be about science and evidence (see Comment Rules).
LikeLike
Reblogged this on The Logical Place.
LikeLiked by 1 person
1. You state, “Countless people (including prominent politicians and even the president) are claiming that cases are not actually increasing,…” This is an erroneous claim. The President has never said cases were not increasing.
2. You state correctly in the following phrase that, “and the apparent increase is simply the result of increased testing.” Actually, the President was attributing the increase due to testing alone, he did not say ‘apparent ‘ increases.
3. The insects in chocolate analogy is not appropriate. It does not take into account the exponential nature of a highly contagious disease.
4. Clearly, increased testing is part of the explanation but not all. Early on, when testing resources were limited, the sample population was dramatically controlled and therefore was not representative of the general population. This is no longer the case. People with symptoms from all demographics are now in the data base and are heavily biased younger. With millions if data points in hand, we can confidently project that mortality rate will drop significantly, just on the basis if a stronger immune system and the absence of comorbidities.
5. Even though you, and all of us, would like ti be able to discuss such questions without politics, it is impossible. The WHO, CDC & Fauci have contradicted themselves multiple times. This cause people to distrust. I am sorry, but I do not believe your post has improved this situation.
LikeLiked by 1 person
1. I don’t know if he has ever explicitly said the words, “coronaviorus is not increasing” but he has repeatedly ignored the increase in cases and gone on and on about increased testing. He has very clearly made the argument that the current increase is due to increased testing, and his supporters have bought it hook line and sinker. The internet is full of people claiming that the current increase is simply a result of testing and he and the politicians that follow him are the source of that claim. Statements such as, “Therefore, with tests, we’re going to have more cases. By having more cases, it sounds bad, but actually what it is, is we’re finding people.” clearly imply that the US is finding many cases simply because of increased testing.
2. Honestly not sure what you are trying to say with this one. It sounds like you are admitting that Trump is arguing that the increase is entirely due to testing, which contradicts your point 1.
3. I did not use exponential growth to keep the analogy simple so that everyone could grasp it. Using exponential growth would not have changed anything though. The simple fact remains that the only way for the percent of tests that are positive to increase is if cases are increasing. This is true regardless of whether the cases are increasing linearly, or exponentially, or logarithmically, etc.
4. We have had representative, population-level testing for quite a while now, yet we are only recently seeing the increase. Additionally, the type of change in testing you are describing would result in lower percentages of positive tests, not higher. Further, you are ignoring things like increased hospitalization rates. As far as mortality rate dropping, if by “mortality rate” you mean deaths per infected individual, it is likely that this time it will be lower due to a higher proportion of young people getting it, better prepared hospitals, etc., however we do still expect total deaths per day (population level mortality rates) to increase (possibly not as high as last time, but they will most likely go up in the next few weeks). There will still be thousands of additional deaths due to the current increase in cases.
5. I think by “contradicted themselves” you mean, “adjusted their position regarding a novel virus as new evidence came to light.” In other words, what actual scientists do.
LikeLiked by 2 people
Re point 5. In politics thanks to politicians and the media changing ones mind is usually seen as a bad thing and labelled as a u turn or going back on something.
In science/ engineering and any other progressive area, it is using up to date data and evidence to inform current thinking (and therefore action).
LikeLiked by 1 person
In your example, you remark that there are 1,000 bars with insects. That is a known total but couldn’t it be argued that we do not know the total of actual cases in the country so we do not know. So in the insect example how do you know the rate is 10%? Through repeated testing groups? ie: continuously get a positive of approximately 10% over and over again.
Thank you for your many articles.
LikeLiked by 1 person
In that example, I am simply stating the actual amount to demonstrate the math. In the real-world, that value exists, but is unknown. My point in the example is that in that situation, we know the actual rate is increasing, and we can see that that increase results in an increase in the percentage of positive tests. In the real world, we don’t know the actual total number of cases, but we can see that the percent of tests that are positive is increasing, and from that, we know that the total number of cases must be increasing.
LikeLike
The example is simple, but there are statistical tools that let you say “if we test 1,000 bars randomly and get 100 with insects, we know that for 10,000 bars manufactured, 95% of the time the total number of bars with insects in them will be in the interval between 814 and 1190.” The problem is that the math gets a little more intense than most people want to get into. Much easier to explain it with the simplified model in the article — most people don’t really want to see college-level statistics (and that includes quite a few math students; statistics was a very unpopular class when I was doing my undergrad).
LikeLiked by 1 person
I do have enjoy reading your posts.
Clear and simplified.
Like you say this is the base maths to it and there are many other factors to it. Such as how good the tests are, inconclusive tests etc.
Re Roy’s point 3 – insects breed quite quickly and could certainly mean a huge increase in insects over time. But like you said, this is to simplify the maths about tests/incidents over time.
Thanks.
LikeLiked by 1 person
There is a logical explanation for this.
Around the country testing facilities are popping up all over that will give you a test for free whether you have symptoms or not. There is an accounting of the result but no filtering of the specific person that got the test or if they have been tested previously. It is hard to make an argument that it is not the number of tests in the problem. But it is not the number of tests that is the problem. Let me explain with an example from my personal experience.
An asymptomatic person or one with only mild symptoms goes in to take a Covid test. Let’s call him John.
Why not since the test is free and they no longer need to show symptoms or get a doctor to prescribe the test. Why are they getting tested? Perhaps John knows someone close to him that tested positive or he is just curious. Unfortunately for John he tests positive. (1 in the positive column) John has heard that false positives are not uncommon and he is feeling fine so he figures, might as well get another test to be sure. After all it is free and there are 5 locations within easy driving distance. Unfortunately again John shows a positive result. (2 in the positive column) Now what?
John goes home to begin his quarantine and as suggested he notifies his friends and family with who he has been in close contact and tells them that they should get tested even if they feel fine like he did. Since the virus is very contagious, out of 10 family members, two test positive. We won’t follow their story but it is largely the same as John’s from here so you can do the math.
So John start his quarantine. He looks at the information he was provided and searches the internet and finds that he should test negative twice within 24 hours before he can end his quarantine. This sucks. John is isolated from his family and friends and he is a social butterfly so this is killing him and again, he feels fine. The next day, miserable from being in quarantine he figures. I feel fine, perhaps it is gone. I’ll just put on my mask and head back over to the testing facility. After all what else can I do with my time. So John gets another test and unfortunately, still positive. (3 in positive column) Bummer. John scours the internet to find out how long he will continue to test positive. So many sources, so much data but no clear answer. 7 days? 14 days? 4 weeks? John considers the possibility of being in quarantine for a long time. But, perhaps John already had the virus for a week or more when he was tested. After all, he never felt sick to begin with. So the next day, with his heart filled with hope, John heads out to get tested again. (5 in the positive column) We won’t chronicle John’s whole experience but I think you get the idea.
If you think this is far fetched, consider that even if John was less of a dick and waited a longer time before getting tested, he would eventually have to get tested again if he ever wants to leave quarantine. Whats the chances that the first retest is negative. No one has the patience to wait until it is guaranteed that virus has passed before getting another test. So every patent that tets positive will test positive at least one more time. Especially if they repeat the first test to make sure.
And yes, each test is included in the statistics as a positive.
We have too much data with little control of how a positive test result for an individual affects the overall analysis and subsequently our public policy. I have read several accounts that claim the number of negative tests is blown up because some people are getting tested multiple time even though they are negative. There is something to that but admits that the results are being double counted and I doubt it comes close to overshadowing the opposite effect of positive people getting tested multiple times.
It is my opinion that we cannot trust any testing data but perhaps Deaths and Hospitalizations. After all, you can only die once but you can be counted twice and even still vote in some states. But even this data, while more accurate, is fraught with problems including the ever present “Died WITH Covid versus died OF Covid”. But the trend should mean something and it stands in opposition to the greater public testing results.
Nice and consistent hospitalization data here: https://gis.cdc.gov/grasp/COVIDNet/COVID19_3.html
If we look at this death and hospitalization data we do not find any correlation to the greater public testing results which are showing dramatic increases in positive results. This is a paper Tiger and we are destroying ourselves with only ourselves and our stupidity to blame. Why? Perhaps we need it to be true.
Being informed is useless if the information is useless. Think for yourself. Question what you hear. Search deep and you may find the truth.
Don’t let fear and emotion rule your life.
LikeLiked by 1 person
There are numerous things wrong here.
First, I don’t know the exact number of free testing clinics in the US, but I have not seen anything to make me think they are common enough for this to even be possible as the explanation.
Second, this is 100% speculative. You have no actual evidence whatsoever to back this up, and I do in fact find it to be ridiculously far fetched. Unless you can present actual evidence that this is occurring and is widespread enough to cause the increase in positive tests, its not a valid counterargument.
Third, as far as hospitalizations, the link you provided states that its data are usually off by several days (meaning that the past few days when we’ve seen massive increases aren’t accurate) and it only includes a small subset of US states, notably failing to include states like FL, AR, and TX (i.e., where the outbreaks are occurring). Hospitalization rates in those states are increasing, even to the point of maxing out TX hospitals. Thus, your hypothetical argument is clearly bogus. It cannot explain that.
Fourth, regarding death rates, as explained in the article, death rates lag infection rates. We don’t expect to see death rates start to climb noticeably for a few days yet.
LikeLiked by 1 person
Mr. Fallacy, again omitting the facts.
The fact is that there is no audit or third-party review of these tests to confirm the accuracy of their reporting. There aren’t even standards set by the Federal Government to guarantee that the states are reporting cases equally. The way New York goes about reporting their cases isn’t the same as the way Florida does; your article looks at the apples and oranges but makes no mention of the banana basket they’re all sitting in.
The fact is that it has been continuously reported several times over the past couple months that some states are counting both the viral and antibody tests, inflating the number of cases by some undetermined number. More recently, the Government Accountability Office issued a report on 6/25 criticizing the CDC over their accounting practices. Your article makes no mention of this or attempts to adjust the numbers by accounting for some number of multiple-positives reported for a single person. (1)(2)(3)(4)
The fact is that cases which are reported on any given day does not necessarily reflect the number of infections occurring at that particular time. For example, former New York Times reporter Alex Berensen reported on Twitter that the “spike” in cases seen at the end of June included more than 600 backdated cases from three or more weeks ago, while the tracker site “ourworldindata.org” noted the spike in COVID deaths on 6/26 included numbers from states that added “probable” (not confirmed) deaths. (5)(6)
The fact is that no test is 100% accurate; even the ‘most accurate’ PCR tests are acknowledged to have as much as a 5% inaccuracy rate. Since you seem to like math: if 5% of the population has the virus, a test with a 95% accuracy rate will result in a false positive 50% of the time while a test with a 99% accuracy will result in a false positive 16% of the time. Furthermore, thanks to the government’s fast-tracking tests through their approval process, companies selling tests aren’t required to have their data evaluated by the FDA. The CDC even acknowledged this in late May. Your article makes no mention nor adjustment for any projected number of inaccurate tests, PCR or antibody. (7)(8)(9)
The fact also is that “false positives” can occur when a test detects an infection from one of the other types of coronaviruses that do not cause COVID; so people with the common cold can test positive for SARS-CoV-2 even when they haven’t contracted it (and it’s estimated that people can be infected with the common cold as many as two or three times a year). It’s also worth mentioning here the evidence that people who get the flu vaccine may be more likely to contract respiratory infections (known as ‘virus interference’), such as SARS-CoV-2 is. Your article makes no mention of this widely acknowledged reality of the tests. (10)(11)(12)
The statement in your article regarding the Texas Medical Center is grossly misleading. For one, the very article you linked is not about the TMC reaching ICU bed capacity but about how the report that they were at capacity was a mistake. Second, you state this inaccuracy as if all of the beds being used are of COVID patients. In actuality (as of 6/30), TMC ICU beds were at 93% capacity with 31% of them identified as COVID patients; so really only 1/3 of the ICU beds being used are because of this virus. Furthermore, the ‘total % capacity’ number is also misleading in this discussion as the TMC CEO has said that they have the ability to “flex” bed capacity as part of their ‘surge plan’… so even a current 93% capacity does not mean the TMC is 7% away from not being able to take on any more COVID patients because they apparently can add more beds if they need to. (13)
You also fail to mention that Medicare pays hospitals for admitting a COVID-19 patient (or even someone ‘presumed’ to have COVID), and pay three-times more if the patient is put on a ventilator. This is per the CARES Act, and was meant not just to cover the cost of care but also to help make-up for the loss of business as hospitals shifted their focus to COVID. In other words, there has been a tremendous incentive for ‘free’ federal dollars by hospitals that inflate the number of COVID cases– and there’s no one reviewing or overseeing any of this to make sure that there aren’t fraudulent reports of COVID. Your article makes no acknowledgement of this widely known fact or attempts to adjust the number of reported cases to account for this. (14)
You fan the flames of fear by predicting there’ll be an increase in death rates in the coming weeks, but conveniently ignore the CDC’s “best estimate” of an Infection Fatality Rate of just 0.26%, which is significantly less than the extremely inaccurate initial estimates based on faulty models. (15)(16)
One thing you do say is absolutely true, however: this isn’t a “liberal conspiracy to undermine Donald Trump”; it is much more nefarious than that. Why don’t you do a post on how a global economy that runs entirely from debt can’t continue to grow indefinitely and, every so often, needs to instead find ways to contract and reduce the monetary demand? (17)
REFERENCES
(1) Virginia misses key marks on virus testing as leaders eye reopening (5/9)
richmond .com/special-report/coronavirus/virginia-misses-key-marks-on-virus-testing-as-leaders-eye-reopening/article_021e12c6-6d20-5030-9068-4caaeda495f7.html
(2) How Virginia Juked Its COVID-19 Data (5/13)
theatlantic .com/health/archive/2020/05/covid-19-tests-combine-virginia/611620/
(3) ‘How Could the CDC Make That Mistake?’ (5/21)
theatlantic .com/health/archive/2020/05/cdc-and-states-are-misreporting-covid-19-test-data-pennsylvania-georgia-texas/611935/
(4) $1 Billion in Government Coronavirus Payments Went to Dead People (6/25)
nytimes .com/2020/06/25/health/coronavirus-cdc-testing.html
(5) twitter .com/alexberenson/status/1278306650596749313
(6) twitter .com/TamarHaspel/status/1278278110954360838/photo/1
(7) Covid-19 antibody tests face a very specific problem (4/22)
evaluate .com/vantage/articles/analysis/spotlight/covid-19-antibody-tests-face-very-specific-problem
(8) COVID-19 Coronavirus Tests Are Pretty Accurate, but Far From Perfect (5/11)
heavy .com/news/2020/05/covid19-coronavirus-tests-accurate/
(9) Antibody tests for Covid-19 wrong up to half the time, CDC says (5/27)
edition.cnn .com/2020/05/26/health/antibody-tests-cdc-coronavirus-wrong/index.html
(10) Accuracy of coronavirus tests questioned after PGA golfer tests positive, and then negative (7/1)
cnbc .com/2020/07/01/accuracy-of-coronavirus-tests-questioned-after-pga-golfer-tests-positive-and-then-negative.html
(11) Test for Past Infection (Antibody Test) | CDC
cdc .gov/coronavirus/2019-ncov/testing/serology-overview.html
(12) Increased Risk of Noninfluenza Respiratory Virus Infections Associated With Receipt of Inactivated Influenza Vaccine (3/15/2012)
academic.oup .com/cid/article/54/12/1778/455098
(13) Judge Hidalgo: Texas Medical Center change in ICU bed capacity reporting is alarming (6/30)
click2houston .com/news/local/2020/07/01/judge-hidalgo-texas-medical-center-change-in-icu-bed-capacity-reporting-is-alarming/
(14) Fact check: Hospitals get paid more if patients listed as COVID-19, on ventilators (4/24)
usatoday .com/story/news/factcheck/2020/04/24/fact-check-medicare-hospitals-paid-more-covid-19-patients-coronavirus/3000638001/
(15) New estimate by CDC reduces COVID-19 death rate to just 0.26% (IFR) from WHO’s 3.4% (CFR) (5/24)
in.dental-tribune .com/news/new-estimate-by-the-cdc-brings-down-the-covid-19-death-rate-to-just-0-26-as-against-whos-3-4/
(16) How Wrong Were the Models and Why? (4/23)
aier .org/article/how-wrong-were-the-models-and-why/
(17) Central Bank Stimulus: Quantitative Easing 5.0 with John Titus (5/23)
home.solari .com/central-bank-stimulus-quantitative-easing-5-0-with-john-titus/
LikeLike
This comment is full of misleading, irrelevant, or incorrect statements. Due to its length, I will just hit the highlights.
First, regarding testing. Sure, tests aren’t full proof and there are errors, but that has been true all along and none of it explains the current spike we are seeing in cases. For example, you’re concerned about 600 cases that were backdated? The US just had a singly day with over 57,000 new cases! The day before that, there were over 50,000 new cases. The types of errors you’re talking about are trifling compared to the massive increase in cases we are seeing. Also, they do not explain the surge not just in cases, but also in the percent of tests that are positive. Again, these issue have been present form day 1. This is all irrelevant because it can’t explain the change in trends.
As far as your probabilities for how many people are getting false positives, your math is wrong. The bayseian formula you used is based on probabilities, not rates. 5% of the population having the disease does not mean that there is a 5% probability that someone who is being tested actually has the disease, because the testing is somewhat targeted. People who have symptoms and people who were in contact with someone with COVID are far more likely to be tested, and their probability of actually having COVID is far higher than the national infection rate. Thus, the actual percentage of false positives will be much, much lower than your estimates.
As far as hospitalizations, you totally ignored my one link showing that 14 states were experiencing increased COVID hospitalization rates. Further, the TMC article was not about the reported rates being inaccurate. It did discuss some disagreement about the rate, but did not say that it was inaccurate and raised concerns that the disagreement was potentially politically motivated. It also stated that hospitalization rates for COVID in Texas have been increasing, and that fact has been confirmed by countless other sources. It is a fact that hospitalization rates for COVID are increasing in many states, and that fact completely debunks your absurd argument about the problems with testing. Finally, as far as ~30% of beds being for COVID, stop and think about that for a second. 30% of all the ICU beds in a massive complex are being used for a single disease! That’s crazy. That is truly remarkable, unless, of course, we are actually in the middle of a massive outbreak.
https://www.statesman.com/news/20200629/with-over-400-new-patients-since-sunday-texas-reports-record-coronavirus-hospitalizations
As far as hospital payments for COVID, that is totally irrelevant. They get more money for COVID because COVID patients need a lot of care, thus it costs hospitals more to care for them. Or are you seriously going to assert that there is a conspiracy with hospitals lying like crazy to rip of the government? If so, you need evidence.
Finally, regarding mortality rates, the numbers you cited are mortalities per infection. So, try and follow me here, if infections increase, then, regardless of the death rate per infection, death rates will also increase. Your argument about death rates, like so much of your comment, is 100% irrelevant.
LikeLiked by 2 people
“100% irrelevant” is a pretty strong statement, especially when I provided sources.
You simply can’t trust the numbers being reported, for any number of reasons (“hospital conspiracy”? no.. administrators going after free Federal money? I mean let’s be serious here..).
Your sources are whack. Even the “covid tracking project” (by The Atlantic, which also- as I cited in my first post- uncovered the dubious multiple-case reporting occurring in several states) has a section on their site explaining why their numbers aren’t necessarily accurate.
On this you and Willy Wonka got nothing but chocolate to stand on, Mr. Fallacy.
LikeLike
Providing sources for an argument doesn’t make that argument relevant for the topic at hand. Again, I’m not disagreeing that there are inaccuracies in the data. Rather, my point is that those inaccuracies have existed all along and cannot come even close to explaining the current massive increase in cases, especially when you couple that with things like increases in hospitalization rates. There is no evidence that the errors in testing/reporting have changed over the past few weeks in a way that would account for the enormous spike we are seeing in cases and percent of tests that are positive.
On the topic of hospitals, you need to provide actual evidence that hospitals are not only lying, but are doing so frequently enough and broadly enough to cause the increases we are seeing. Otherwise, it is pure conjecture (i.e., not logically valid; technically it is an ad hoc fallacy), and is actually a conspiracy theory, because in addition to administrators agreeing to fudge the data, doctors, nurses, and countless other people have to agree to fake the data. I’m no legal expert, but I imagine the penalties for getting caught doing that would be steep enough to far outweigh the benefits and make most doctors, administrators, etc. unlikely to lie frequently enough to cause the increase we are seeing (it would, after all, be pretty easy for the government to audit them and see if they are lying because treating a covid patient would require a massive string of paperwork for patient charts, prescriptions, nurse records, etc.). Again, you are describing a conspiracy whether you like it or not, and you have no evidence to back it up.
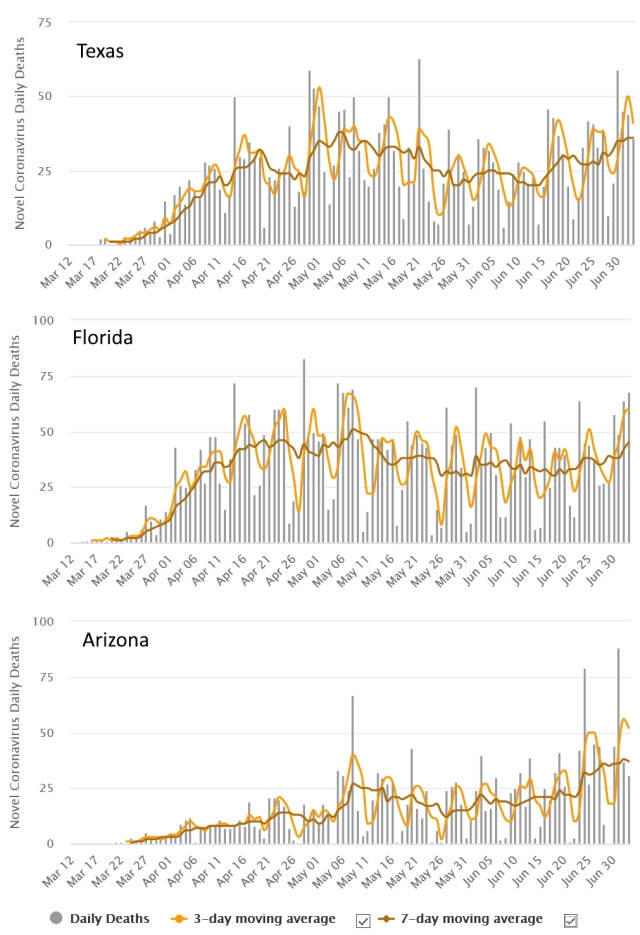
Finally, I will add that when I wrote this post several days ago, no clear trend was viable in the deaths. That is no longer the case when you look at hotspot states like Arizona, Florida, and Texas. The trends are, fortunately, still slight (though, again, I suspect they will go up in the coming weeks), but upward trends starting around the beginning of June (particularly for the past two weeks) are visible (particularly in Texas and Arizona).
graph source https://www.worldometers.info/coronavirus/country/us/
LikeLiked by 1 person
I never said hospitals are “fudging the data” or “lying”. I provided a source– the USA Today “Fact Check” article– that explicitly says that hospitals are receiving an increase in funding for COVID diagnosis, in part, to help ‘make up for loss business’. That’s not me accusing hospitals of being liberal with their COVID diagnosis– that’s someone in a mainstream news source ‘fact-checking’ claims with 1,000 times more credibility than you because at least they’re willing to put a name to their article saying that not all of the Medicare funding is going to treat COVID patients.
Administrators are responsible for keeping the lights-on and their staff paid. Hospitals have lost a ton of business throughout this pandemic. If a mainstream news source is acknowledging that some undetermined amount of the additional Medicare funding is going to ‘make up for loss business’ during the pandemic, then that’s the claim you need to address. Dismissing it as a “conspiracy theory” by my is just LAZY, Mr. Fallacy. I shouldn’t need specific examples; the behavior of human beings with the responsibilities of a hospital administrator with free federal money being flung around having NO OVERSIGHT over how it is used is rather predictable. If you honestly believe ever dollar of the Medicare funding is going strictly to treat patients with COVID and every case being reported is legit (even with all the evidence that merely “probable” cases are being reported), then I’ve got a bridge in Brooklyn to sell you.
My larger point on the issue, which you failed completely to address, is that there’s NO OVERSIGHT on any of this. No one is checking to see where the additional Medicare funds for a COVID diagnosis is going or ensuring that those cases being reported are confirmed cases of COVID and aren’t simply tack-ons to individuals with other comorbidities. No one is checking to make sure the states are reporting cases accurately– something that, as recently as two weeks ago, our own government acknowledged was inaccurate (see: GAO rips into CDC reference). No one is holding testing companies to stringent requirements for the tests they’re selling or reviewing their accuracy or data.
You fancy yourself as someone who respects the “logic of science”, but on this topic you are more than willing to accept statistics that have every sign of being inaccurate– whether it’s the method/manner of the reporting of cases or the accuracy of the tests themselves or the review process over any/all of this. How can you defend that as logical?
LikeLike
“I never said hospitals are “fudging the data” or “lying”.” Um, yes you did, Here is a quote from your first comment (my emphasis): “In other words, there has been a tremendous incentive for ‘free’ federal dollars by hospitals that INFLATE the number of COVID cases– and there’s no one reviewing or overseeing any of this to make sure that there aren’t FRAUDULENT reports of COVID.” So you think hospitals are “inflating the number” are making “fraudulent reports” but aren’t “fudging the numbers” or “lying”????? What the crap are you talking about? Further, in the rest of this very comment, you accuse hospital administrators of making false reports to get money (i.e, fudging data and lying). You’re contradicting yourself.
Again, your sources simply show that hospitals get more money for COVID. I agree (again this is because it costs more to treat COVID and, as you acknowledge, to keep hospitals afloat during COVID). However, that fact does not lead to the conclusion that hospitals are committing wide-scale fraud to inflate the numbers. That’s my point. You need actual evidence that this fraud is not only occurring, but is occurring at a wide enough scale to cause the trends we are seeing, and you don’t have it. “That which can be stated without evidence can be dismissed without evidence.” The sources you cited do not show that hospitals are inflating the numbers to get more money. Unless you have actual data to show that hospitals are committing fraud on a massive scale, your argument is invalid (also, again, it would be very easy for the government to audit the hospitals, and I have to image the consequences of fraud are serious).
Again, as I have said over and over again, you need actual evidence that widespread fraud is occurring, and you don’t have it. Similarly, you need actual evidence that the reporting not only has errors (as it does) but that the errors are so insanely huge and so absurdly wide-spread that they are resulting in hundreds of thousands of false positives, AND those errors are for some reason becoming worse over time resulting in an increase in both the total number of cases and the percent of tests that are false positives. There is absolutely no reason to think that any of that is true, and you have provided no evidence to back it up. You are making this insane and logically invalid jump from, “there are issues with testing” (fact) to “testing is not only completely and totally unreliable, but it is actually, through some mysterious means, resulting in massively increasing trends” (unsubstantiated conjecture)
In short, you have conjecture and conspiracies, and I want facts and evidence. Unless you can provide actual evidence that the increasing trends are CAUSED by errors (not simply that errors exist) and that hospitals are committing widespread fraud, then you don’t have an argument.
LikeLiked by 1 person
Let me try to put this another way. 23 states are now showing increases in COVID hospitalizations, with true extraordinary numbers in states like Texas. There are two potential explanations. 1 COVID cases are actually increasing. or 2. Administrators at hundreds of hospitals have all decided not simply to defraud the government, but to do so on an extraordinary scale, faking tens of thousands of tests and thousands of hospitalizations. Pulling this off is going to require the forgery of countless medical documents, and the co-conspiring of essentially all of the doctors, nurses, pharmacists, etc. who work at these hospitals, any one of which could blow the whistle and publicly say, “actually, we don’t have many COVID patients; the numbers aren’t increasing; there are plenty of beds; it’s all a scam.” Further, given the extraordinary extent of deception that would be required, it would be extremely easy for the government to audit these hospitals and find out that they did not have exponentially increasing numbers of COVID patients. So the administrators would be taking an extraordinary risk.
One of those two options is a completely rational acceptance of facts. The other, is an utterly insane conspiracy theory. Occam’s razor tells us that the explanation that makes the fewest assumptions is usually the correct one, and your explanation makes one extraordinary assumption after another. Similarly, the burden of proof is very much on you. Unless you can show compelling evidence that hundreds of hospital administrators have all decided to commit fraud, forge documents, and convince their staff to keep quiet, then you simply don’t have a case.
https://www.cnbc.com/2020/07/06/coronavirus-hospitalizations-grow-in-more-than-20-states-as-texas-admissions-soar-to-new-record.html?fbclid=IwAR1sIanplB_YyYkVmka7L_VB_xLbGXbKrU6DPtisQskwpUa2ojnpH-TZ71I
LikeLiked by 1 person
It’s not fraud if it’s allowed under the CARES Act.
It’s not suspicious if there’s problems with the testing (false positives, multiple-counting of a single positive, other coronavirus strains testing positive for CoV-2) and accuracy of the tests (no data confirmation by the FDA) used to begin with.
It’s never checked if there’s no mechanism employed by the government to audit anything– although the GAO has in fact been critical of the CDC’s accounting, a point you continue to ignore.
There’s evidence of backdated cases being counted, and it’s widely acknowledged that “presumed” cases are being counted as if they’re confirmed.
You still ignore the larger point– WHICH IS NO ONE IS CHECKING ANY OF THIS. There is no standard set by the government for the counting of cases. States are reporting their cases differently. If one day Texas just decided to count their cases like New York does, well that would be one reason to explain the increase of testing. As would backdating cases. As would false and double-counted positives. As would unverified and inaccurate tests. As would administrators trying to keep their hospitals open.
Occam’s Razor doesn’t hold in this example. There are too many variables with too much evidence of inaccuracies and too much potential for unchecked practices. It’s not about some ‘massive conspiracy’; it’s about the complete lack of oversight and direction from the federal government making for an environment where anyone can claim anything– with people like you just accepting it as fact.
LikeLike
“It’s not fraud if it’s allowed under the CARES Act.” again, what the crap are you talking about? You’re the one who accused them of fraud! Again, here are YOUR words (my emphasis) “there’s no one reviewing or overseeing any of this to make sure that there aren’t FRAUDULENT reports of COVID.” So which is it, is it fraud or isn’t it?
The CARES act allows hospitals to get more money fro treating COVID patients, it does not allow them to claim that they are treating COVID patients who they aren’t treating (i.e., the type of deception you keep accusing them of).. So either, they are accurately reporting their numbers, in which case, the hospitalizations are actually going up and you have no basis for your argument, or they are lying about the number of cases to get more money, in which case, you need to provide evidence for that (and don’t bother trying to shift your argument to claim that hospitals are not deliberately lying, they are all just hopelessly bad at knowing how many patients they have and are accidentally massively misreporting things in a way that just happens to show a rapidly escalating situation).
Again, as I have said over and over again, you need actual evidence to show that wide-scale fraud is happening. Simply saying, “there’s no oversight” is not sufficient. That statement does not lead to the conclusion that there is extremely massive wide-scale fraud over countless hospitals to inflate the numbers for the sake of money, nor does it lead to the conclusion that the errors are extremely directional and have shifted in the past few weeks to result in an utterly enormous increase in the number of cases as well as an increase in the percent positive rate.
Occam’s razor absolutely applies because you are making countless assumptions for which you have no evidence. I’m not “ignoring” the existence of errors in the data or the lack of rigid quality control, rather the point is simply that those factors do not explain the current trends. They would be expected to show a noisy data set, with lots of variation from one day and week to the next. They would not be expected to show a trend of rapid exponential increase during the initial outbreak, followed by a gradual reduction, followed by another massive increase that coincides with a relaxing of prevention measures that were put in place after the first increase and coinciding with an increase in hospitalization rates. Your argument simply cannot account for the trends in the data.
I really can’t waste any more time trying to explain this to you over and over again. If you have actual evidence of wide-scale fraud by hospitals and, not simply some errors in testing, but massive errors to the point that testing is totally unreliable, coupled with a directionality to the errors such that they produce the observed trends rather than simply statistical noise,then present that evidence. Otherwise, you simply don’t have an argument, and there is no point in continuing this.
LikeLiked by 1 person
I know I said I was done responding to you, but I happened to see the updated death rates for Texas (the main state we’ve been talking about regarding increasing hospitalization) and the deaths are increasing even more clearly now than they were when I pointed the increase out to you a few days ago (a fact which you ignored). This cannot be explained by errors in testing or any of the other nonsense you’ve been arguing. It is a simple fact that cases are increasing and people are being hospitalized and even dying as a result.
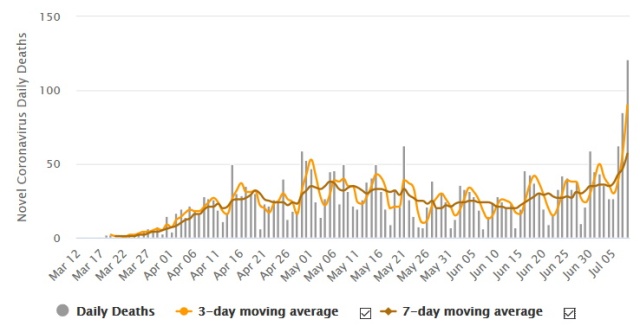
graph source https://www.worldometers.info/coronavirus/usa/texas/
LikeLiked by 1 person
Excellent information. My only question is how the subjects ( or in the example chocolates) are chosen. With the COVID-19 testing, would one not suspect that those getting tested are tested fir a reason, such as they think they may have been exposed to the virus. Would this selection be different than a true random selection?
LikeLiked by 1 person
There is a note about this at the end of the article, but in short, you are correct that the chocolate bar example is random, whereas COVID testing is semi-targeted (i.e., people with symptoms or who have been in contact with someone with symptoms are more likely to be tested). I made this simplification to keep the math straight forward for everyone. However, that doesn’t change the central point. It is still true, even with target testing, that an increase in percent of positive tests still indicates and actual increase in cases. Indeed, it is actually more strongly indicative, because with semi-targeted testing, an increase in tests while cases remain stable or increase slightly actually results in a decrease in the percent of tests that are positive. Thus, you need a large increase in cases to get an increase in the percent of tests that are positive.
LikeLike
Thanks, I enjoyed the article – you have a great deal more patience than I would regarding Mr Herring! But in the course of the discussion I feel my understanding of the issues around testing etc is now a lot clearer, thanks once again for taking the time for the public good.
LikeLiked by 1 person
As a general rule, my motivation for debating people is not to convince the person I’m debating that they are wrong, but rather to provide information for others who may have heard similar arguments but are not committed to them.
LikeLike